Finding and conclusions
Survey
There were 169 responses to the survey from 164 contributors at the end of April 2023. This is fewer than the first stage (as expected), but more than the previous IRMP received at any stage.
When considering the priority order and importance of each risk, there are some variations, depending on how it is calculated. Taking the most voted risk places health and wellbeing as the bottom priority (red column in chart below). Taking a more robust cumulative score across all priorities places it seventh (green column in chart below). The top three remain the same.
The fairest way to calculate priority is to look at the total score across all 12 ranking positions (multiplying the number of people who voted by the priority score and adding them all together). This also more accurately reflects the poll result.
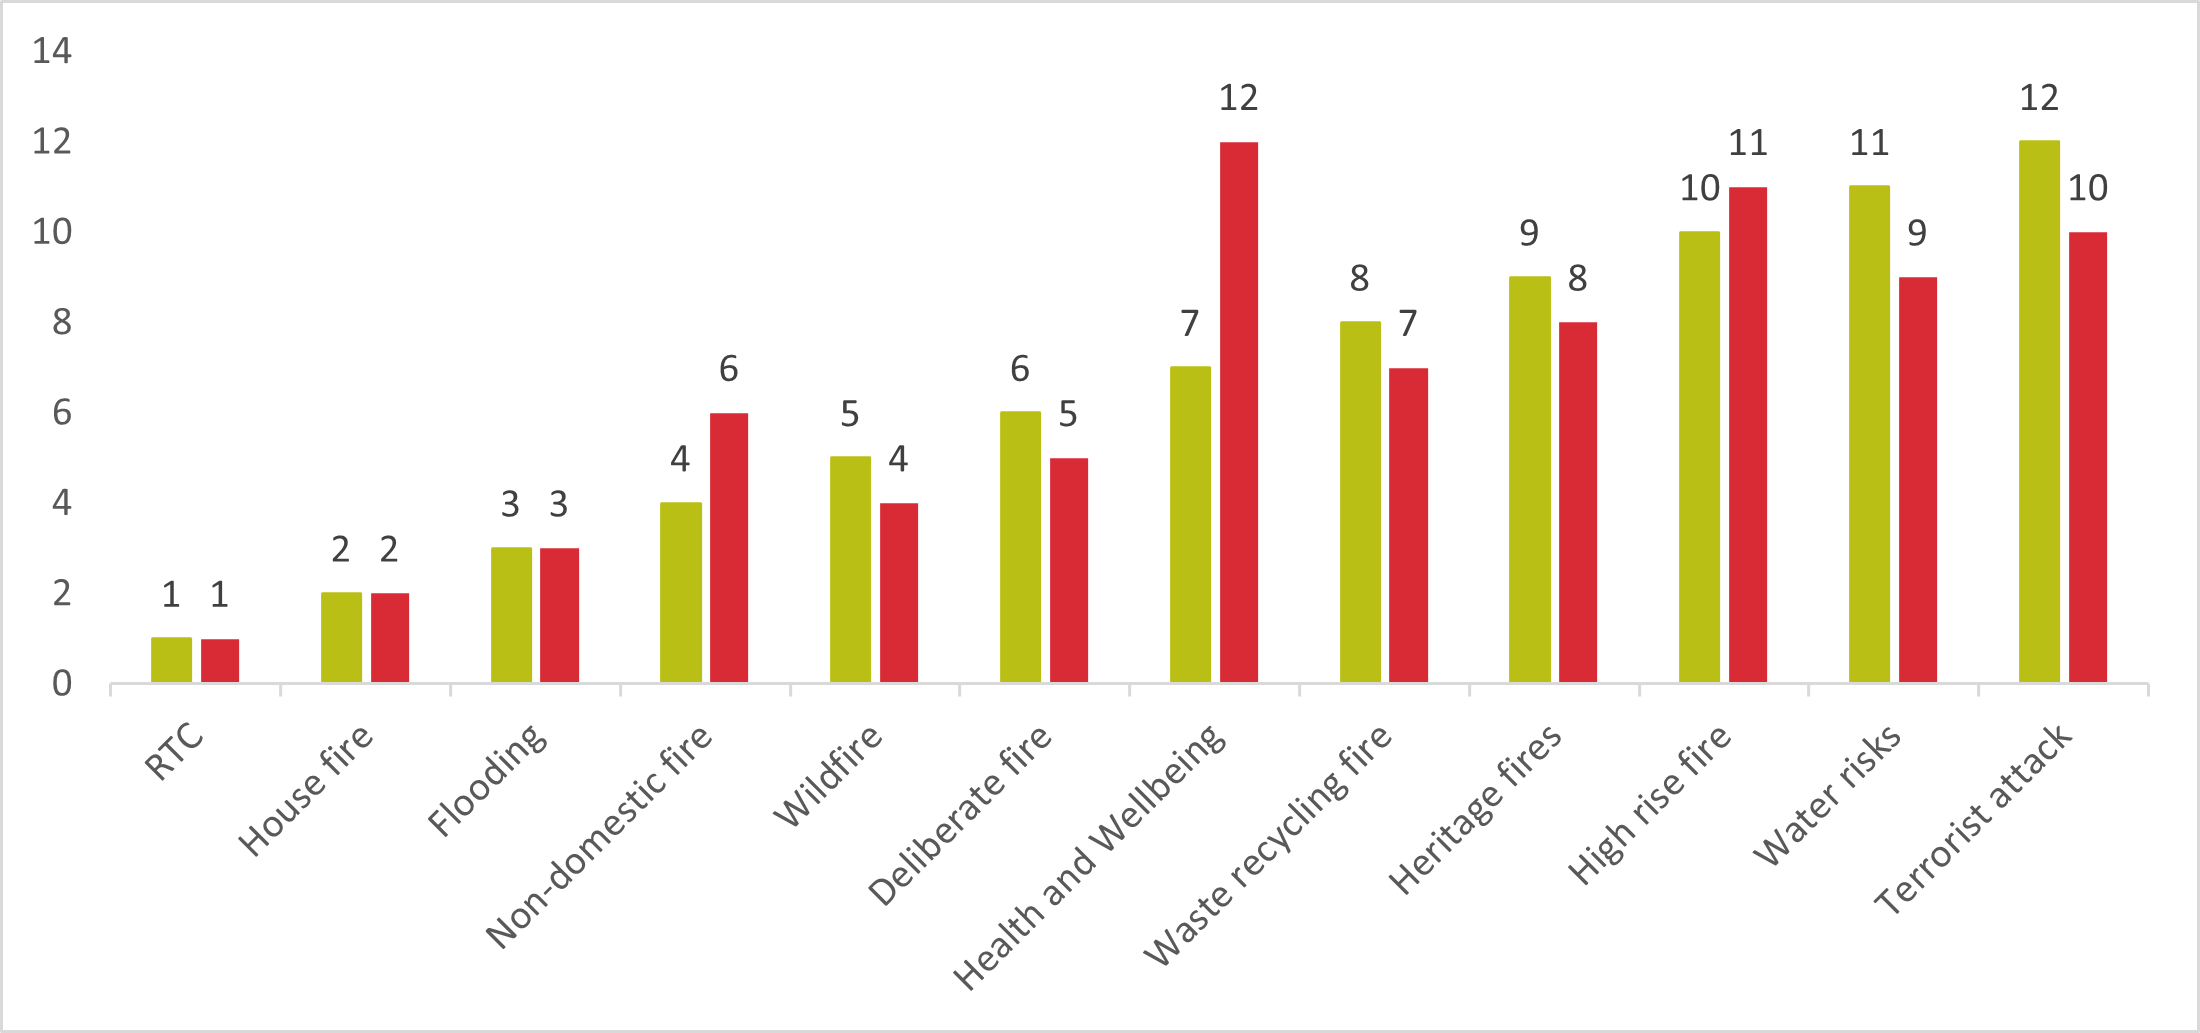
- more than half of all respondents ranked road traffic collisions (RTCs) as their most important risk (86, 51%). Over nine in ten had this risk in their top three (154, 91%)
- four in ten respondents ranked dwelling fires as their second most important risk (68, 40%). Almost eight in ten had this risk in their top three (130, 77%)
- three in ten respondents ranked flooding as their third most important risk (51, 30%). More than four in ten had this risk in their top three (72, 43%)
- flooding remained the most frequently voted fourth most important risk (27) and wildfires were the most frequently voted for fifth most important risk (30)
- a terrorist attack was the most voted for lowest priority risk (46, 27%)
- the overall order is slightly different to the number of votes received in stage 1
Reasoning
Thirty-five respondents added further comments, the most common were:
- a difficult choice to establish priorities (7)
- risk to or preservation of life must be prioritised (5)
- climate and environmental concerns, primarily in relation to flooding risk (5)
Other remarks included:
- many of the non-statutory services can be delivered by, or with, other agencies (4)
- prioritise tackling fires (3 plus1 specific to dwelling fires)
- ranked based on the likelihood of them affecting me or the community (3)
Most comments were neutral (75%), 15% mixed and 10% negative. The negative remarks related to ranking being too complicated (2), a lack of action on flooding (1) and highways issues (1).
Findings by characteristic
There was little difference between the general population’s view and those with protected or SHERMAN characteristics:
- people describing themselves as having reduced mobility or physical or sensory impairment mirrored the general responding population entirely
- those with a drug or alcohol dependency ranked domestic fires slightly higher than RTCs
- smokers had the same top three as the general population, but with very little between domestic fires and RTCs, but a much larger gap between them and flooding
- respondents with mental health issues ranked domestic fires and RTCs in the same way as the general population, but water risks were ranked much more highly than other cohorts
- people from non-White British backgrounds had the same top two as the general population, but deliberate fires or arson, which was a slightly different list to that in phase 1. This is a limitation of looking at small numbers and a further reason to ensure engagement with minority ethnic groups continues to be a focus
- there was little geographic difference in risk priority. North Kesteven (31 respondents) was the only district that ranked dwelling fires above RTCs (one point margin)
- the 33 respondents living in Lincoln top three issues matched the broader population, but seven people also included high rise fires in their top 3. This is likely a result of the concentration of this type of building in the city, compared to other parts of the county
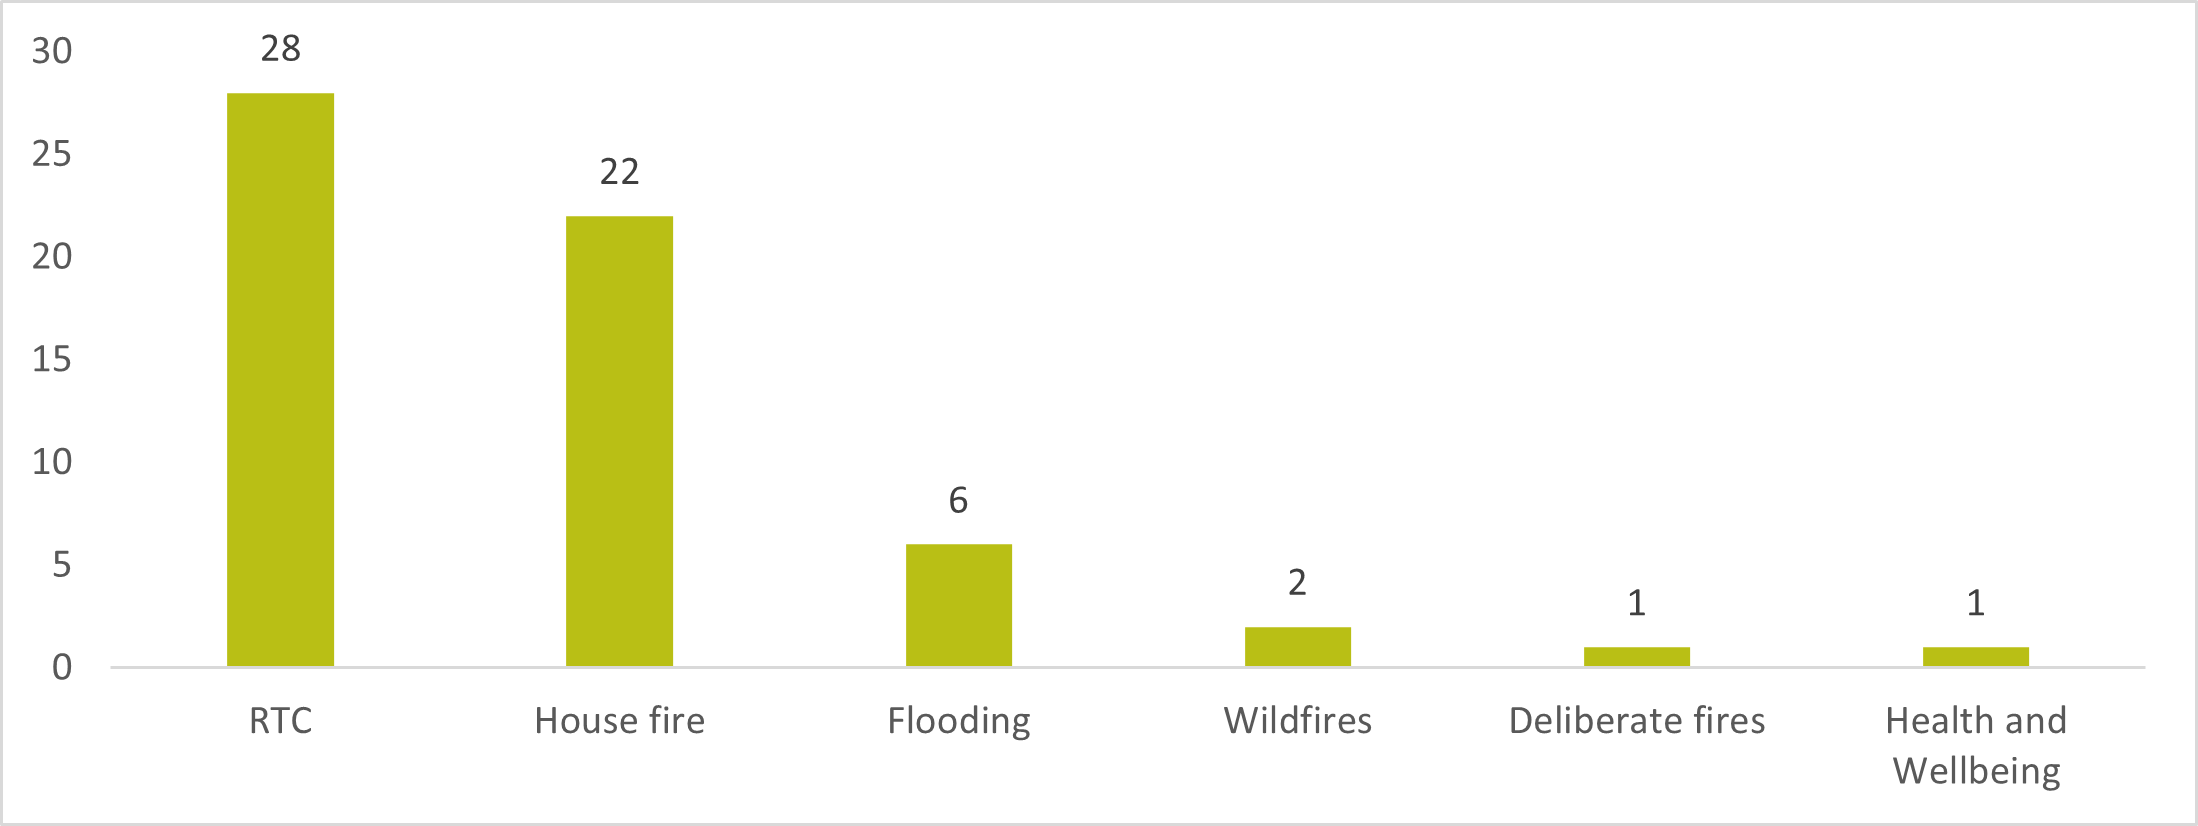
Poll
Only six categories received a vote in the quick poll. They were spread mainly across RTCs and house fires, which reflects the survey, with flooding coming in third. The other three categories shared just four votes.
Conclusions and next steps
The findings of this survey are self-explanatory. It is recommended that what the public has said is considered when looking at operational statistics and resource impact while preparing the CRMP document for consultation.
Keep the poll open to the public until after the early May bank holidays. This will allow QR code use to continue as part of general engagement at high-footfall events.
The EqIA will be updated in response to stakeholder participation analysis and their views, which broadly matched the wider population.
The prize draw winner will be notified and respondents receive feedback on the results.
Learning for stage three includes:
- utilise all forms of traditional and social media available to promote
- continue to target people who participated in stage 1 as they will now be better informed about various aspects of the process and services
- continue to drip feed communications to maintain interest in the CRMP and recruit consultees
- recruit the newly re-established single equalities council to further support and encourage participation among seldom heard individuals
- approach the colleges and universities in advance to arrange face-to-face sessions with young adults, particularly during Freshers activities in early autumn
- in addition to learning from this round of engagement, discussions will be held with public health regarding the presentation of their reports and plans
Appendices
EqIA update to follow before publishing report.