Findings and conclusions
Findings
There were 621 page visitors. Of that number, 308 people clicked for further information and 173 of them completed 174 surveys. This is a 28% visitor to respondent conversion rate, which given the nature of the topic, is positive. Most respondents came from social media (70) or used an email link they had received directly (67). This reflects the way the survey was promoted.
Comments or reasons were sought from those who disagreed. Reasons related mostly to using averages. They were seen to conceal poor performance and don’t identify the best performance so provide less informative or valuable data. They were also seen as potentially unfair in a rural county where times or averages aren’t comparable with predominantly urban or smaller areas.
Sentiment analysis to establish general feeling across 115 performance expectations comments showed a balanced view, although marginally more were negative (31%) than positive (26%).
When using mention analysis as a means of identifying the common themes, there is a similar split in opinion, but no particularly strong feelings. The top six themes, with the main sentiment were:
- Using the new reporting standard is clearer (21). Comments were 71% positive
- Consider remote and rural access issues and times (18) Comments were 33% mixed
- Reporting response times would be or was clearer (17). Comments were 59% negative
- The amended reporting is seen as reducing standards (15). Comments were 87% negative
- Speed of attendance is vital (11). Comments were 46% negative
- The new standard of averages is acceptable (10). Comments were 53% positive
Respondents were asked to identify any concerns and benefits they had based on protected characteristics or issues affecting their household, for example, disability or rurality.
Respondents (312 potential impacts or households identifying they fit into this category) are shown in this chart:
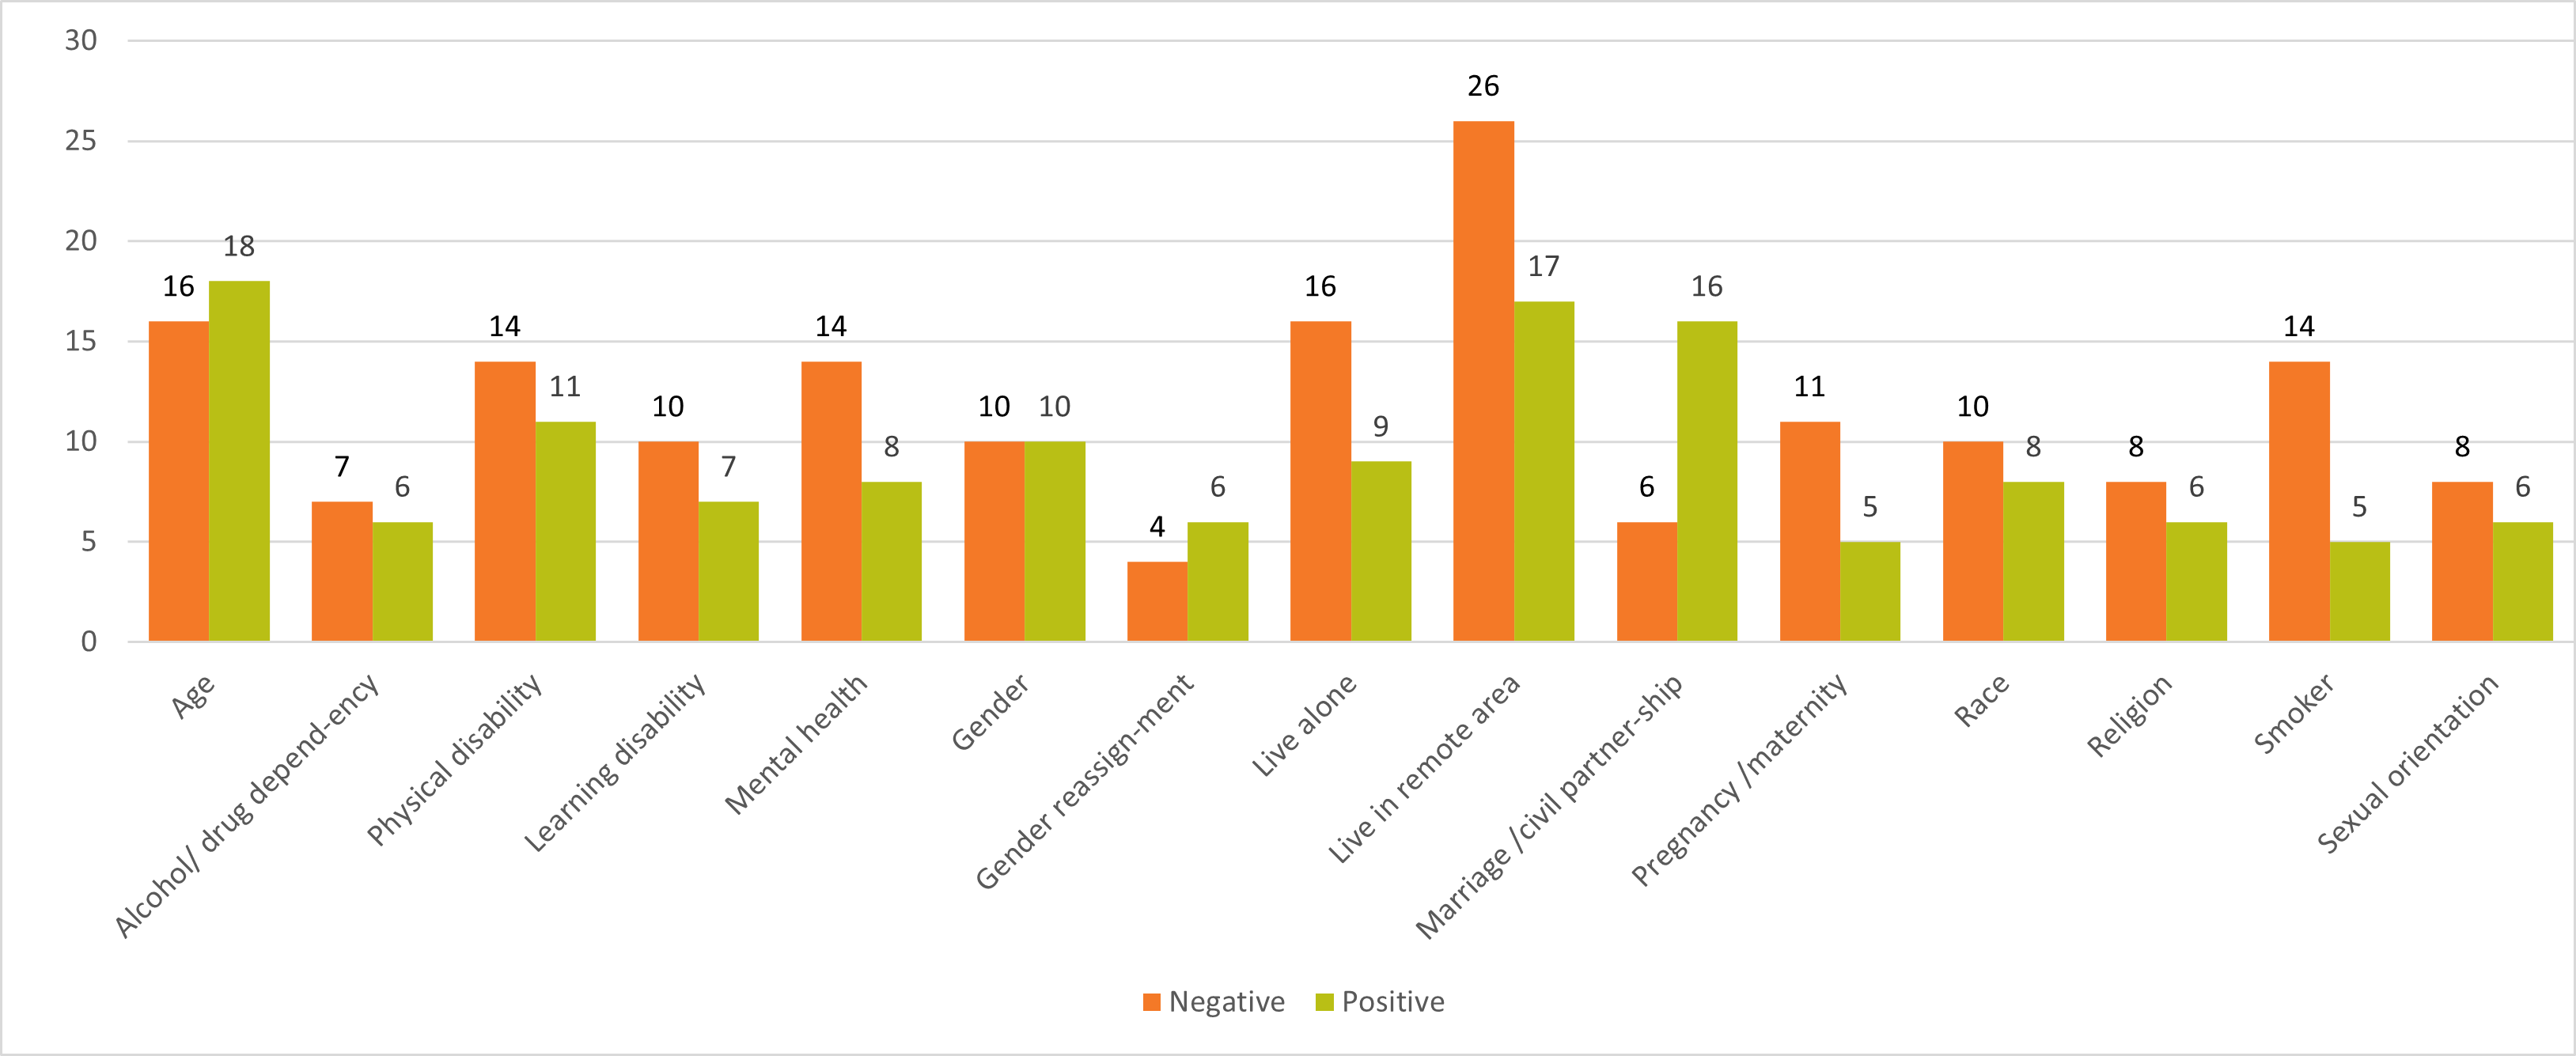
| Category | Negative | Positive |
|---|---|---|
| Age | 16 | 18 |
| Alcohol or drug dependency | 7 | 6 |
| Physical learning | 14 | 11 |
| Learning disability | 10 | 7 |
| Mental health | 14 | 8 |
| Gender | 10 | 10 |
| Gender reassignment | 4 | 6 |
| Live alone | 16 | 9 |
| Live in remote area | 26 | 17 |
| Marriage or civil partnership | 6 | 16 |
| Pregnancy or maternity | 11 | 5 |
| Race | 10 | 8 |
| Religion | 8 | 6 |
| Smoker | 14 | 5 |
| Sexual orientation | 8 | 6 |
Note respondents could tick all that applied so some will be the same household. They identified a potential impact of the change in reporting and 49 comments were provided:
- The greatest number of people identifying a negative impact was 26 (15%) relating to living in a rural area. This category had greatest negative disparity (9) between negative and positive.
- The greatest number of people identifying a positive impact was 18 (13%) in relation to age.
- Marriage or civil partnership had the greatest positive difference (11) between positive and negative.
Conclusions and next steps
It can be concluded that the majority agreement and simplicity of the proposed reporting helps the general understanding and reflects how other areas report, which enables comparison. It is important to note that detailed data is still collected and analysed for internal purposes.
The findings of this engagement were reported to communities scrutiny, and they agreed that the new approach should be implemented. At the meeting on 21 March 2023 average response times were reported as being below the 11-minute target.
Questions from elected members related to whether poor parking had contributed to any delays in reaching fires. The Assistant Chief Fire Officer was not aware of recent parking related delays, but advised committee that they:
- target leaflet drops if problems are identified, and
- post proactive, preventative messages on social media