Findings and conclusions
In the spring survey we received the following results:
- Being well informed about our service
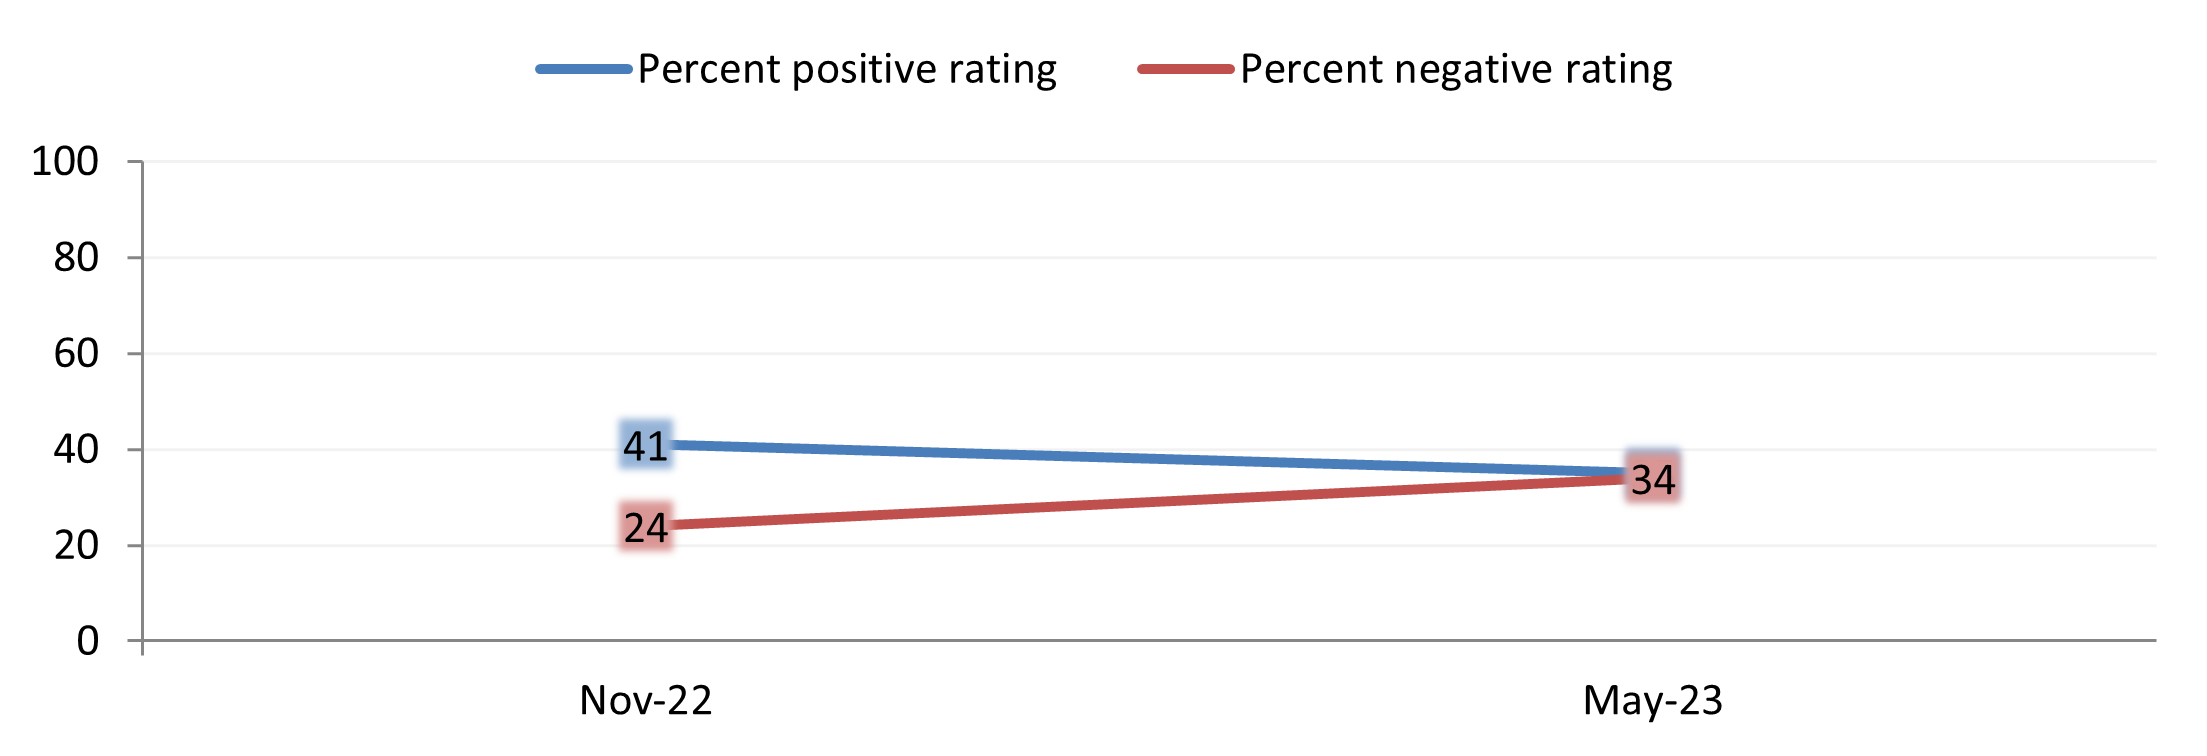
The percentage of people saying they’re very well or well informed about our service has fallen from the last survey from 41% to 35%. The percentage of people being not well or not at all informed has risen by 10% from 24% to 34%.
- Listening and acting on resident’s concerns
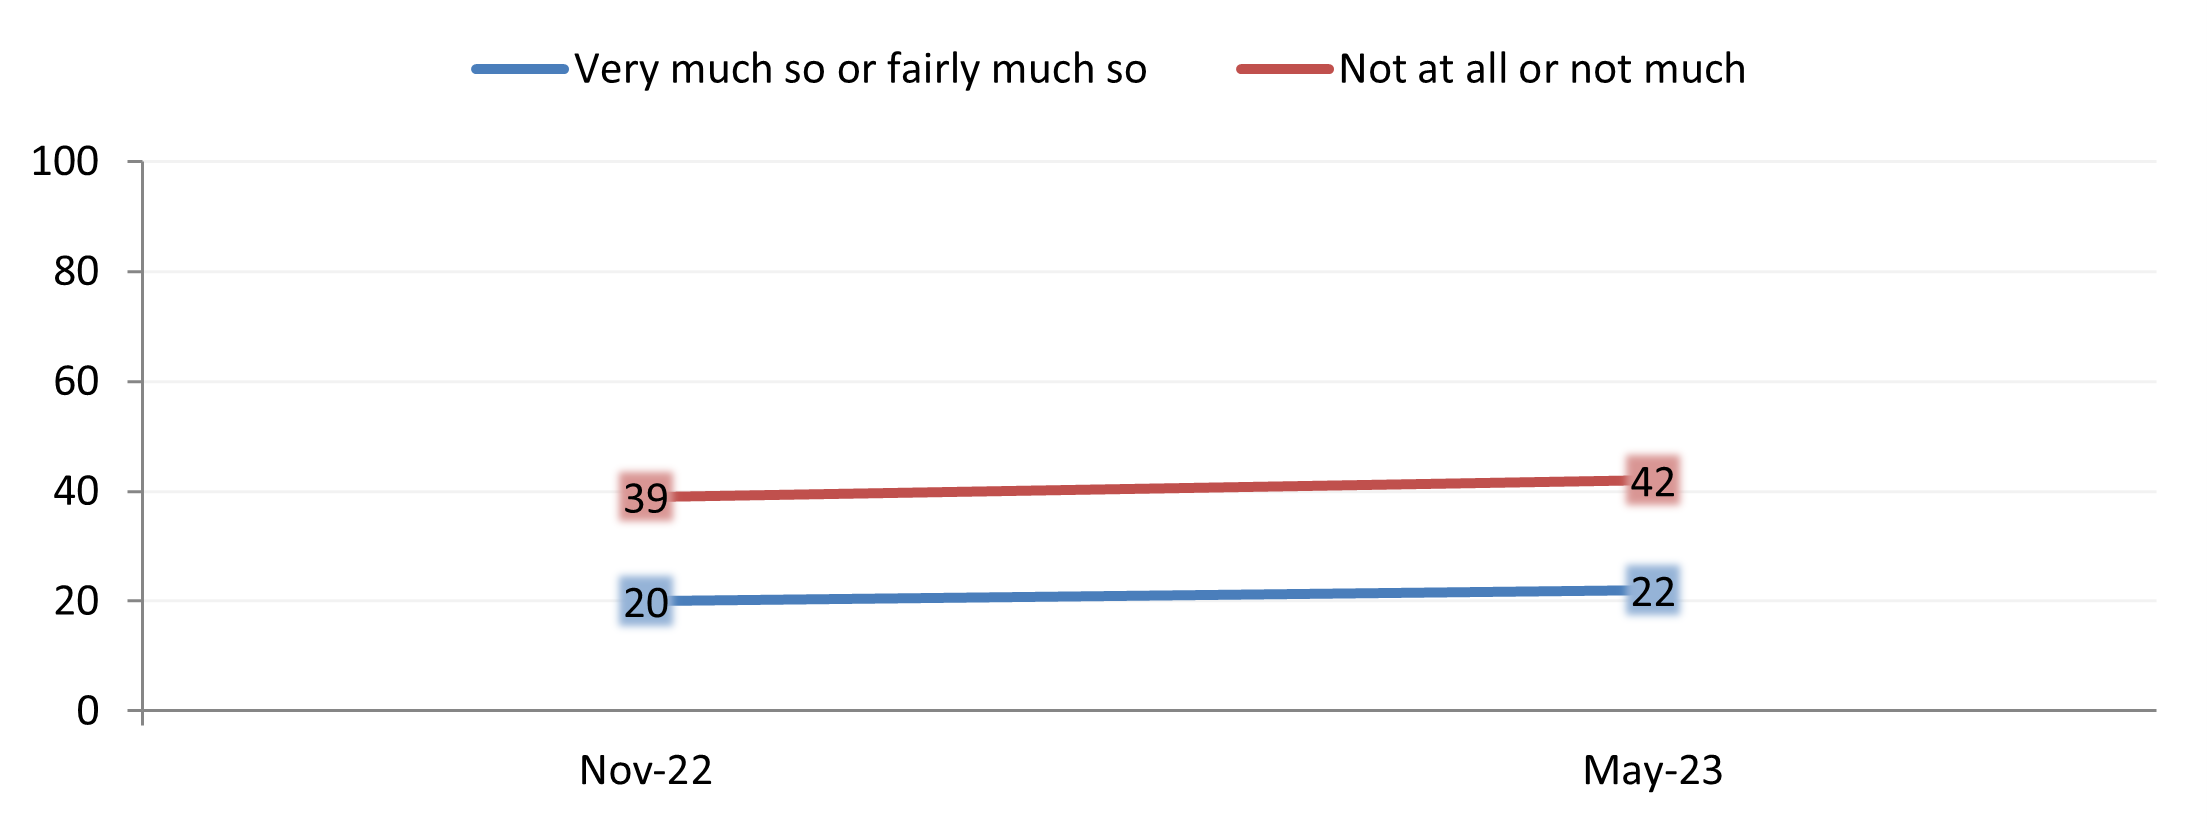
The percentage of people who said we listen to and act on resident’s concerns very, or fairly much so has risen from the last survey from 20% to 22%. The percentage of people who said we do not listen or act on resident’s concerns much or at all has risen from 39% to 42%.
- Providing value for money
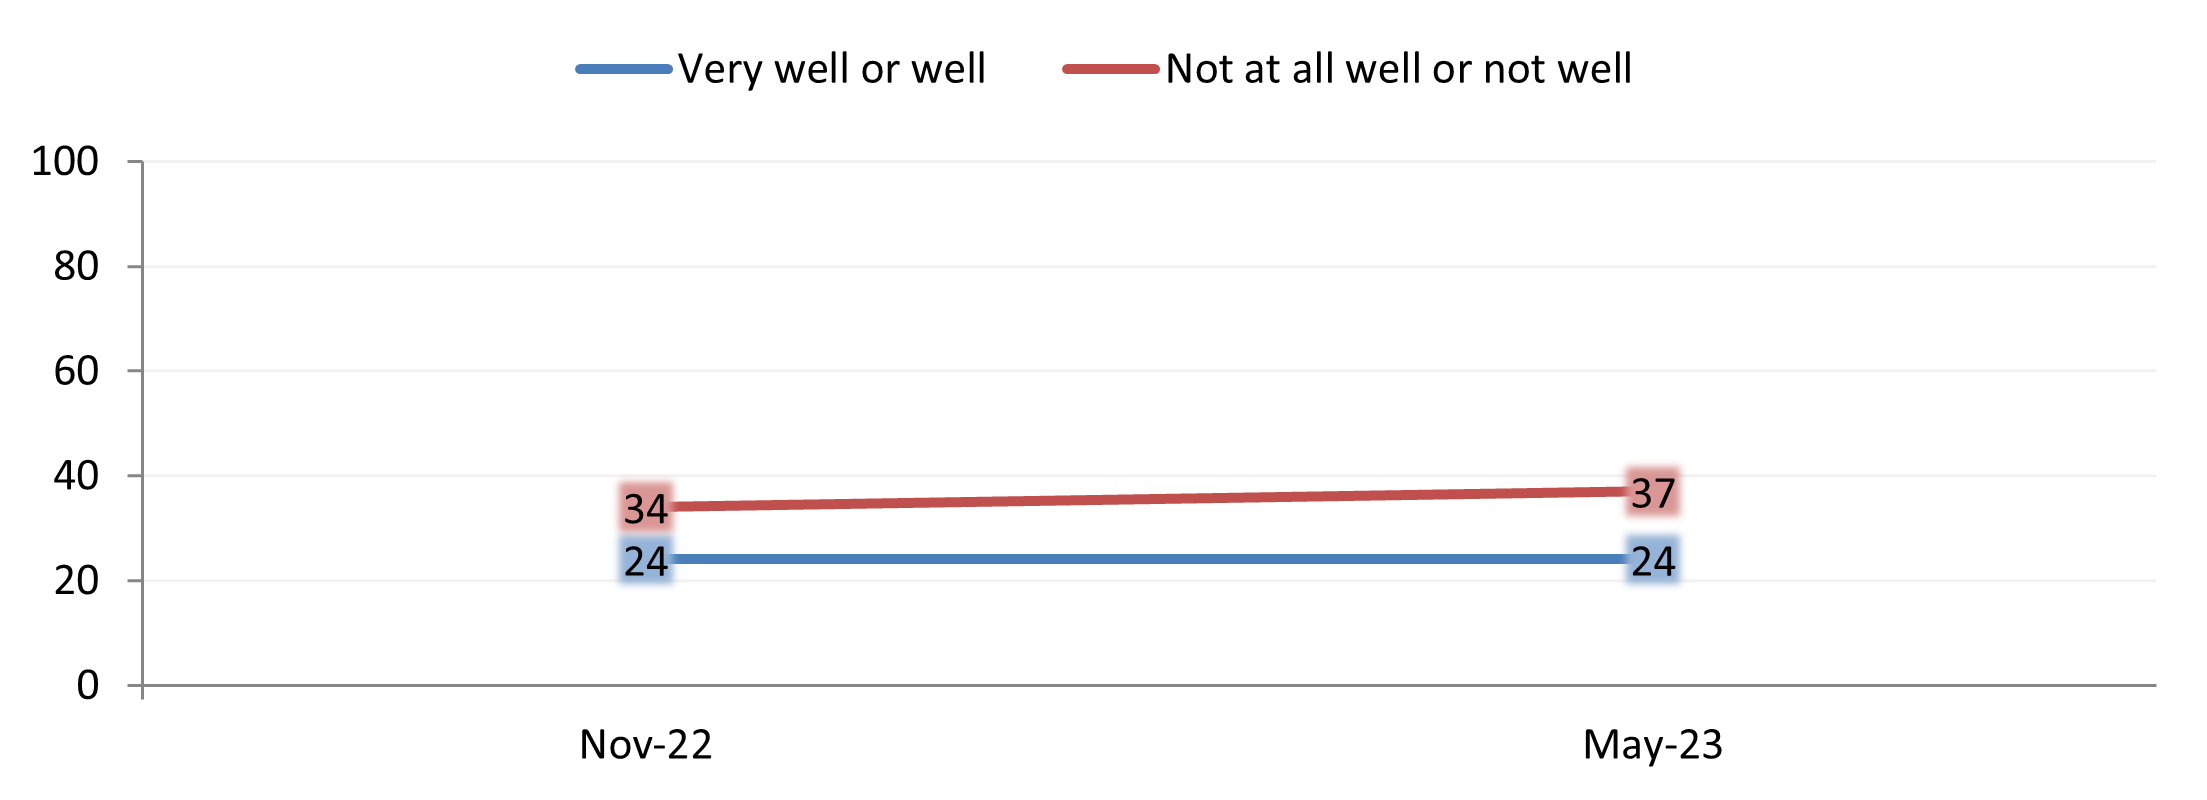
The percentage of people who said we provide value for money very well or well has stayed the same for both surveys (24%). The percentage of people who said we do not provide value for money well or at all has risen from 34% to 37%.
- Trusting the council
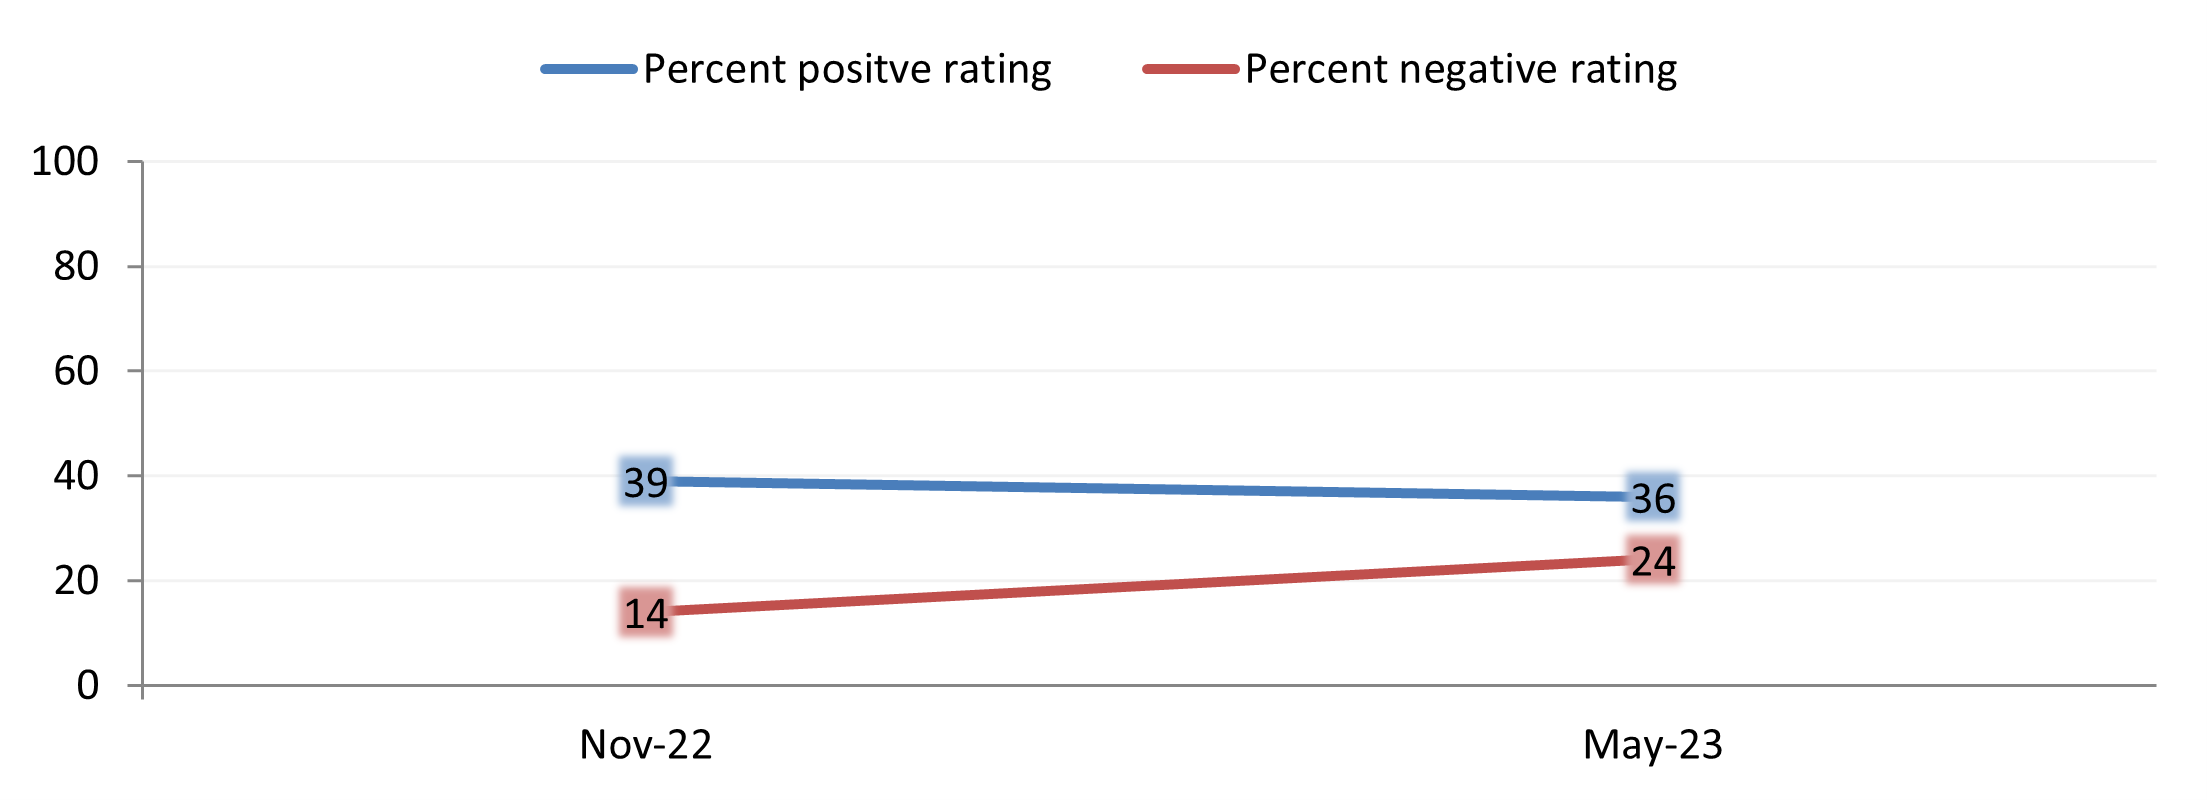
The percentage of people who said we were very trustworthy or trustworthy as a council has fallen from the last survey from 39% to 36%. The percentage of people who said we were untrustworthy or very untrustworthy as a council has risen by 10 percentage points from 14% to 24%.
- Overall satisfaction with the council
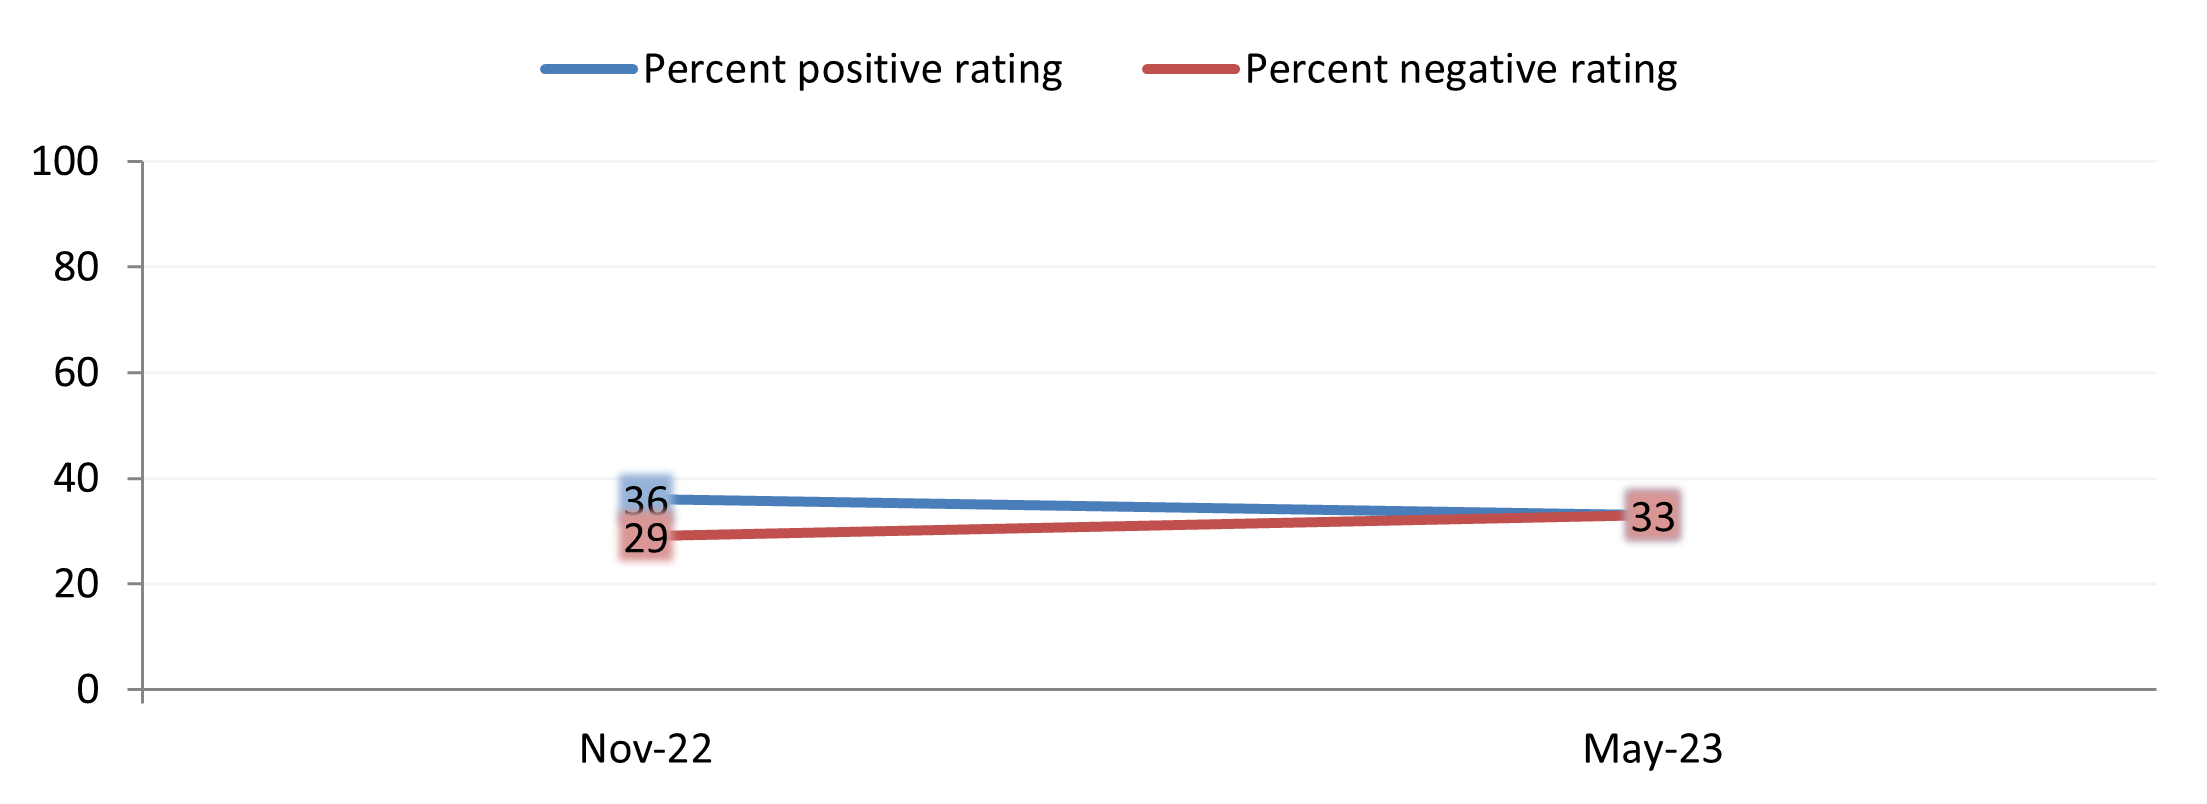
The percentage of people who said they were very satisfied or satisfied with Lincolnshire County Council overall has fallen from the last survey from 36% to 33%. The percentage of people who said they were dissatisfied or very dissatisfied with Lincolnshire County Council overall has risen from 29% to 33%.
To view the survey results in more detail please visit our County Views report page. Here you can see the Power BI (Business Intelligence) report which shows further data in graphs and charts.
To view the results from our further engagement in spring 2023 with registered users about their experiences and thoughts of the council and its services visit Let’s talk Lincolnshire.
Recurring questions
Question one – How informed would you say you are about our services?
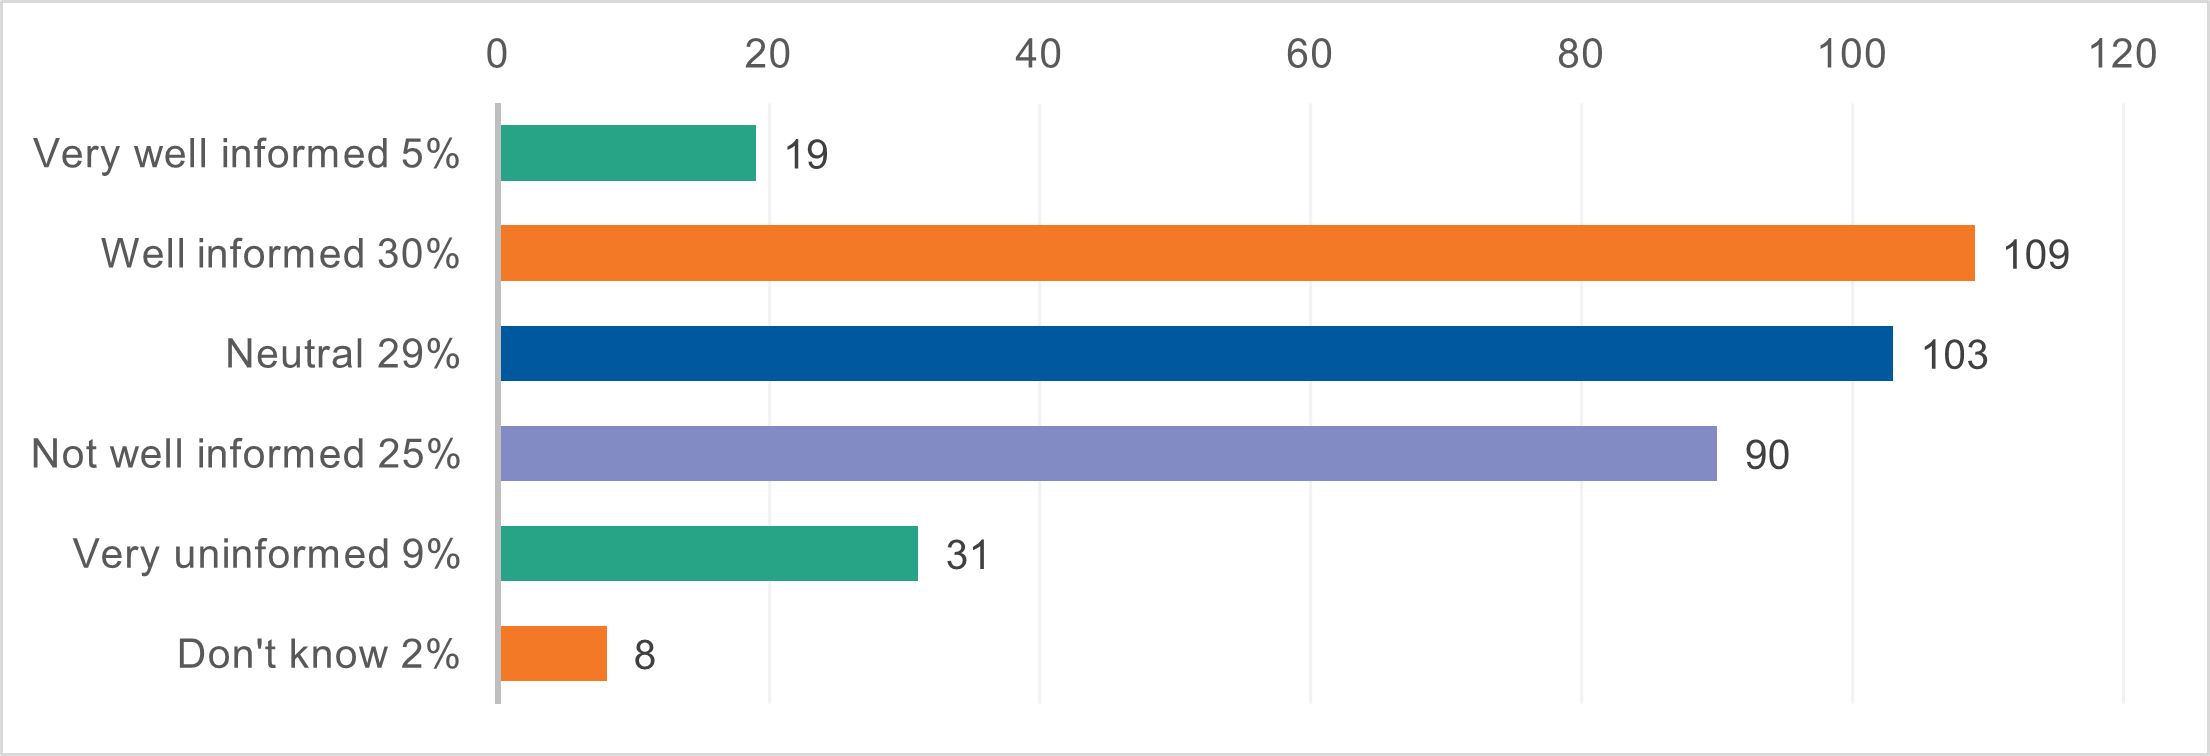
- 128 respondents (35%) said they were very well informed or well informed about our services
- 121 respondents (34%) said they were very uninformed or not well informed about our services
Age
Younger adults remain more positive and less negative with 60% (12) of registered respondents aged 44 and under and 43% (85) of respondents aged 45 and over were positive in their answers about how informed they were about our services. 20% (4) of respondents aged 44 and under and 25% (50) of respondents aged 45 and over were negative in their rating.
District
Registered respondents from City of Lincoln (68%, 16) were the most positive in their answers about how informed they were about our services. Registered respondents from South Holland (43%, 6) were the most negative in their rating.
Disability
39% (20) of registered respondents with a disability and 48% (78) of those without a disability were positive in their answers about how informed they were about our services. 29% (15) of registered respondents with a disability and 22% (36) of those without a disability were negative.
Question two – How much would you say we listen to and act on resident’s concerns?
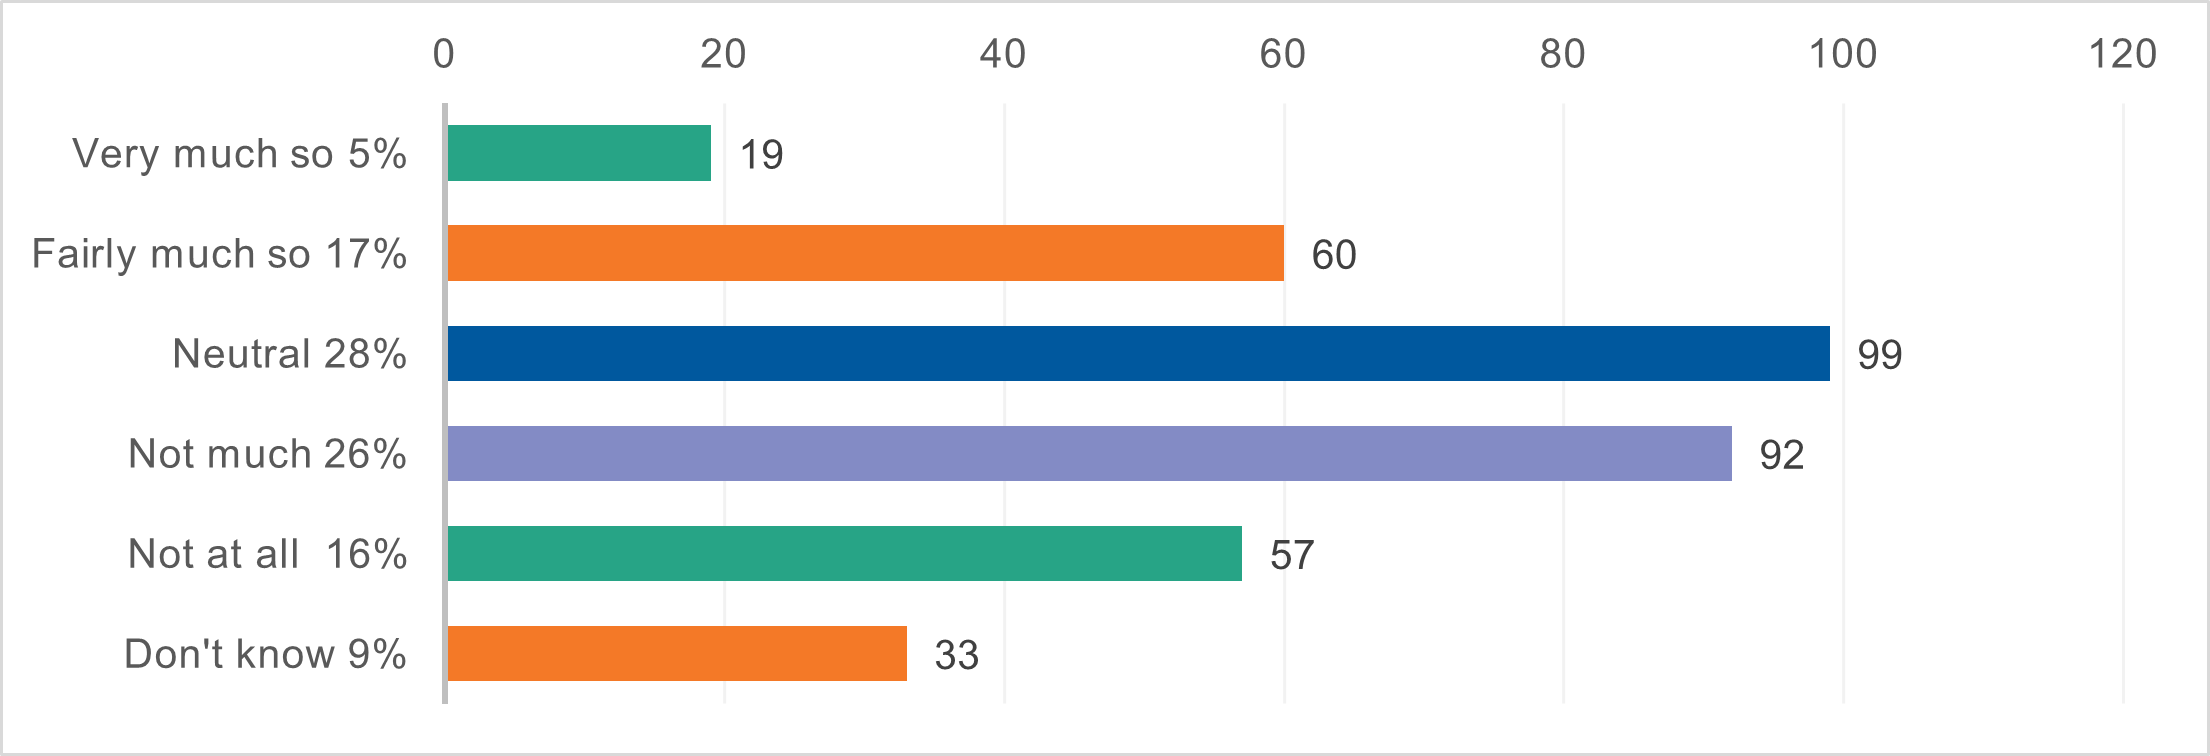
- 79 respondents (22%) said we listen to and act on resident’s concerns very or fairly much
- 149 respondents (42%) said we do not listen and act on resident’s concerns much or at all
Age
30% (6) of registered respondents aged 44 and under and 27% (53) of registered respondents 45 and older were positive in their rating. Whereas 20% (4) of respondents aged 44 and under and 36% (70) of respondents 45 and older were negative. 45% (9) of registered respondents aged 44 and under were neutral in their responses. This was the highest percentage of neutral responses across all questions comparing by age groups.
District
Registered respondents from West Lindsey (37%, 16) were the most positive in their answers about listening and acting on residents’ concerns. Registered respondents from South Holland (57%, 8) were the most negative in their rating.
Disability
30% (15) of registered respondents with a disability, and 27% (44) of registered respondents without, were positive in their answers about listening and acting on residents’ concerns. Whereas 36% (18) of registered respondents with a disability and 34% (55) of registered respondents without a disability were negative. That was the highest negative rating across all questions comparing by disability.
Question three – How well would you say we provide value for money?
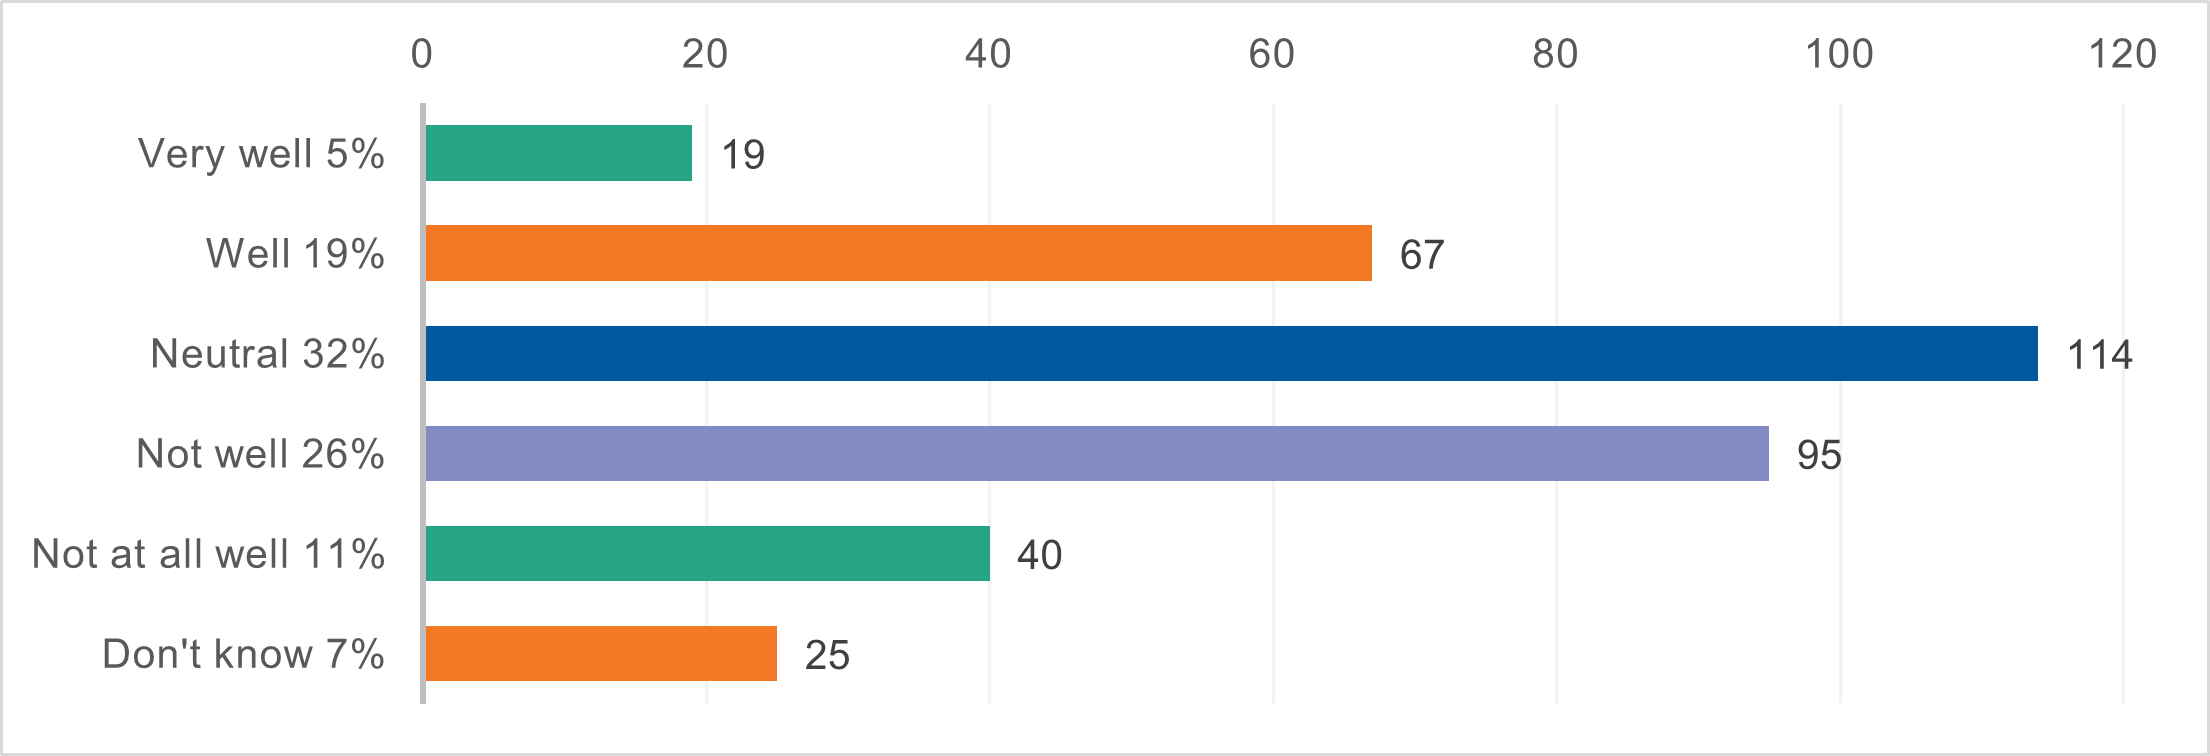
- 86 respondents (24%) said we provide value for money very well or well
- 135 respondents (37%) said we do not provide value for money well or at all well
Age
50% (10) of registered respondents 44 and under and 28% (55) of registered respondents 45 and over were positive when answering the question about value for money. 10% (2) of registered respondents 44 and under and 33% (66) of registered respondents 45 and over were negative.
District
Registered respondents from City of Lincoln (50%, 11) were the most positive in their answers about providing value for money. Registered respondents from South Holland (64%, 9) were the most negative in their rating. 50% (24) of registered respondents from North Kesteven were neutral in their responses. This was the highest percentage of neutral responses across all questions comparing by district area.
Disability
28% (14) of registered respondents with a disability and 32% (52) of registered respondents without were positive when answering the value for money question. Whereas 22% (10) of registered respondents with a disability and 34% (55) of registered respondents without a disability were negative.
Question four – How much would you say you trust us as a council?
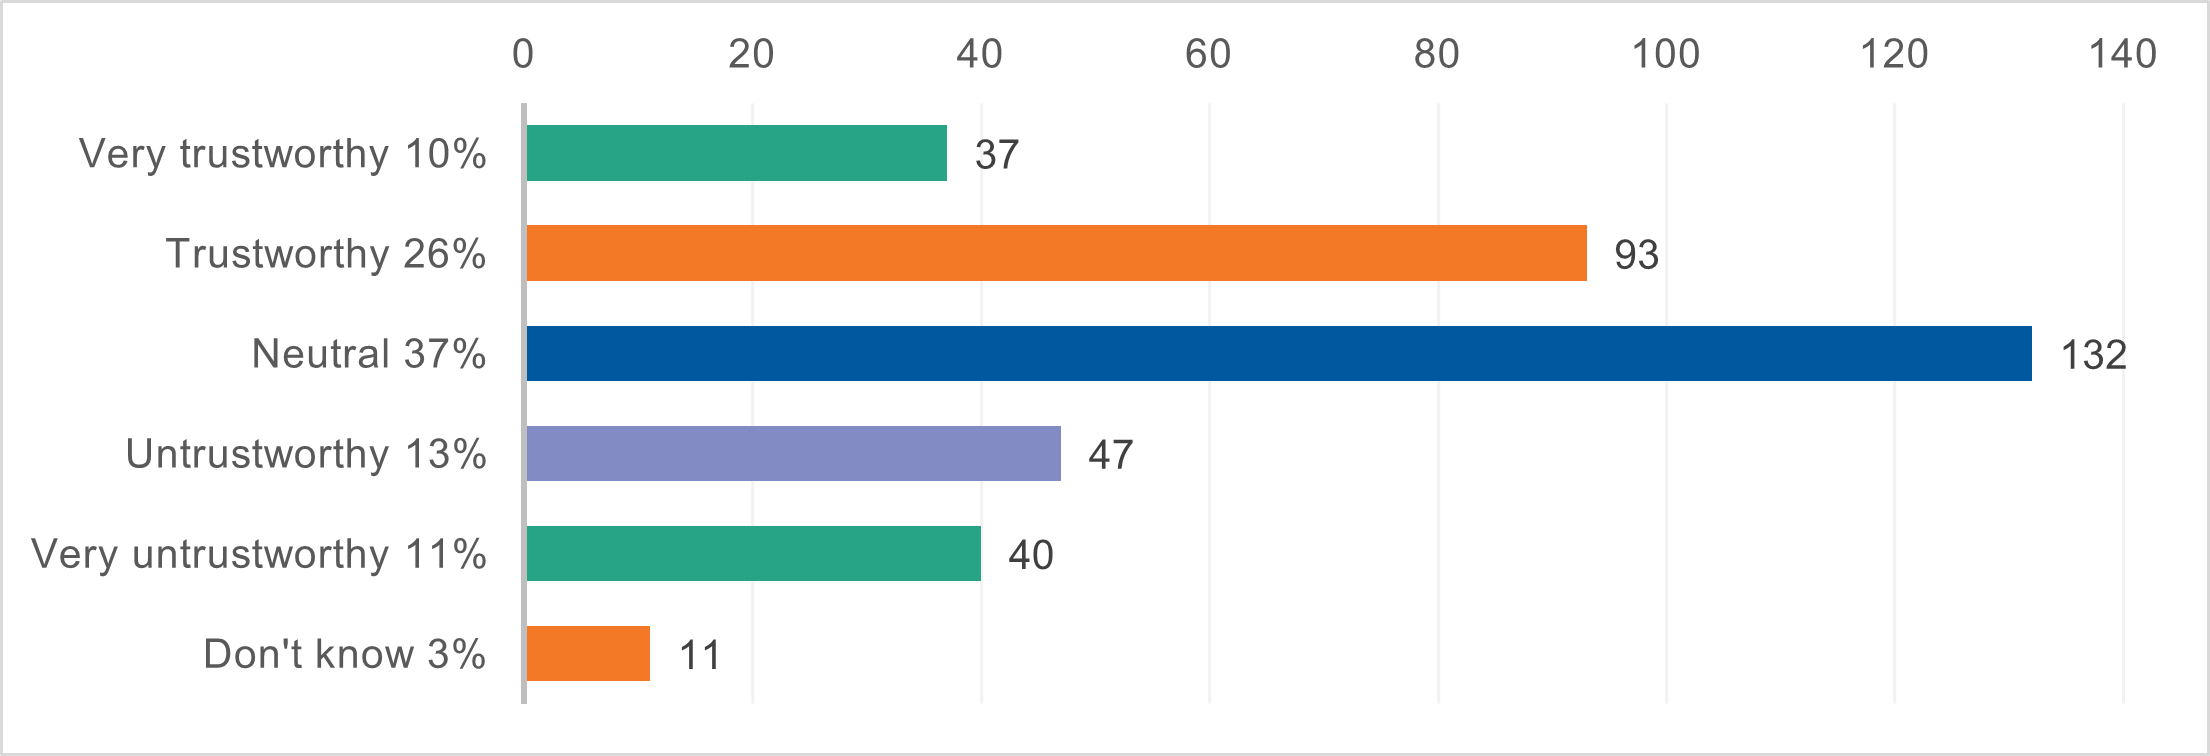
- 130 respondents (36%) said we were very trustworthy or trustworthy as a council
- 87 respondents (24%) said we were untrustworthy or very untrustworthy as a council
Age
65% (13) of registered respondents 44 and under and 48% (94) of registered respondents 45 and over said we were very trustworthy or trustworthy. This is the highest positive rating across all questions when comparing by age. 5% (1) of respondents 44 and under and 14% (27) respondents 45 and over were negative. This is the lowest negative rating across all questions when comparing by age.
District
Registered respondents from North Kesteven (55%, 26) said the council was very trustworthy or trustworthy. Registered respondents from City of Lincoln (18%, 4) said we were untrustworthy or very untrustworthy.
Disability
51% (26) of registered respondents with a disability and 50% (82) of registered respondents without a disability were positive when answering the question about value for money. This is the highest positive rating across all questions when comparing by disability. Just 14% (7) of registered respondents with a disability and 12% (20) without a disability were negative. This is the lowest negative rating across all questions when comparing by disability.
Question five – Overall how would you rate Lincolnshire County Council?
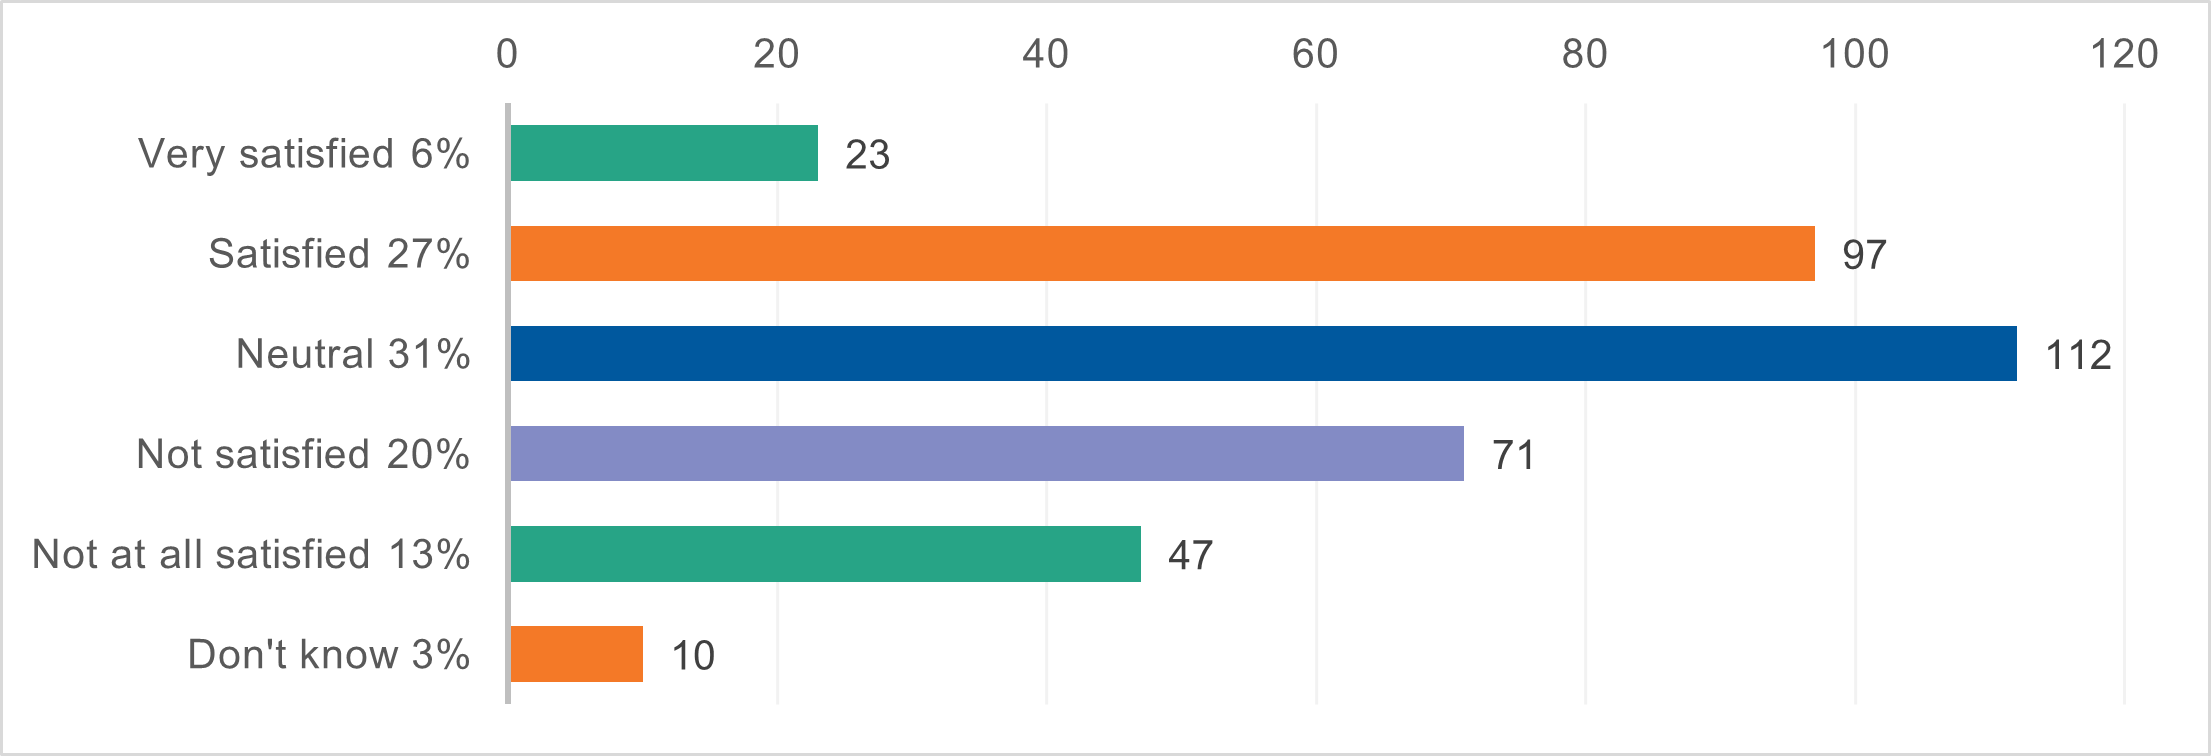
- 120 respondents (33%) were very satisfied or satisfied with Lincolnshire County Council
- 118 respondents (33%) were not at all or not satisfied with Lincolnshire County Council
Age
65% (13) of registered respondents 44 and under and 38% (75) of registered respondents 45 and over said they were very satisfied or satisfied with Lincolnshire County Council overall. Whereas 5% (1) of registered respondents 44 and under and 28% (56) of registered respondents 45 and over were negative in the rating, which is a vast difference.
District
Registered respondents from Boston Borough (55%, 5) were the most satisfied with Lincolnshire County Council overall. Registered respondents from South Holland (64%, 9) were the least satisfied with Lincolnshire County Council overall.
Disability
41% (21) of registered respondents with a disability and 42% (68) of registered respondents without a disability said they were very satisfied or satisfied with Lincolnshire County Council overall. Whereas 22% (11) of registered respondents with a disability and 27% (44) of registered respondents without a disability were negative.
Helping people access information about care
In the second part of the survey, we asked about directories which we provide to help people find the care and support they need. This includes our website and the Connect to Support website. We also asked how information should best be made available for people when needed.
Question six – If you needed information about care and support needs for yourself, a family member or someone else, where would you go to find it? (multiple choice)
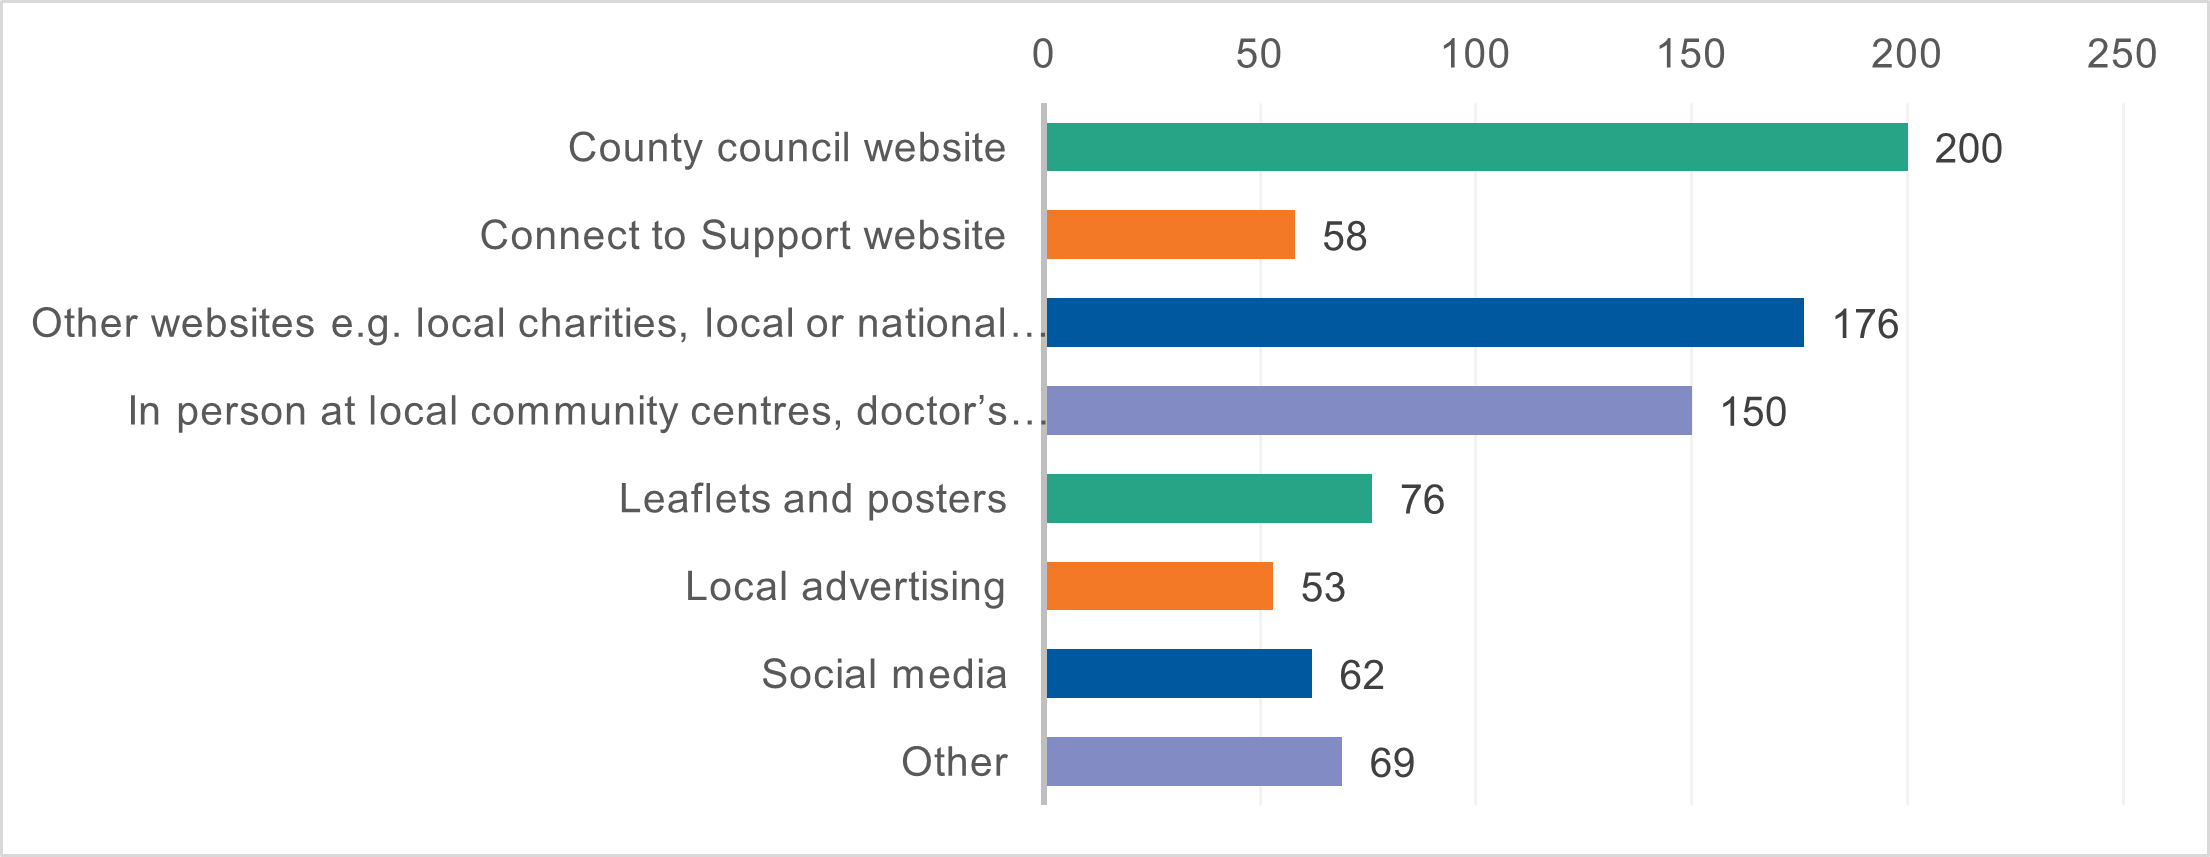
The top three choices for finding information about care and support needs were:
- council website (200 responses)
- other websites for example local charities, local or national services (176 responses)
- in person for example at local community centres or doctor’s surgeries (150 responses)
There were 69 ‘other, please specify’ suggestions where people would go to find they information for themselves or others. The suggestions included:
- word of mouth or ask others (28 responses)
- search engines for example google or other websites (18 responses)
- telephone (9 responses)
Age
There was a slight difference in priorities when comparing by age among registered respondents. Registered respondents aged 44 and under selected county council website as their first. Followed by social media and other websites as a second choice equally.
District
The responses from the following areas were slightly different to the general trends.
Registered respondents from Boston Borough selected other websites and social media equally as their second choice.
Social media was third choice in West Lindsey. In City of Lincoln in person, social media were selected as third choice equally.
Registered respondents from East Lindsey selected other websites as their first choice, followed by council website and in person.
Disability
The results from registered respondents with a disability show there was no difference in views or opinions to those without a disability.
Question seven - What information would you expect to access on the county council website to help you, a family member or someone else to remain safe, well and independent? (multiple choice question)
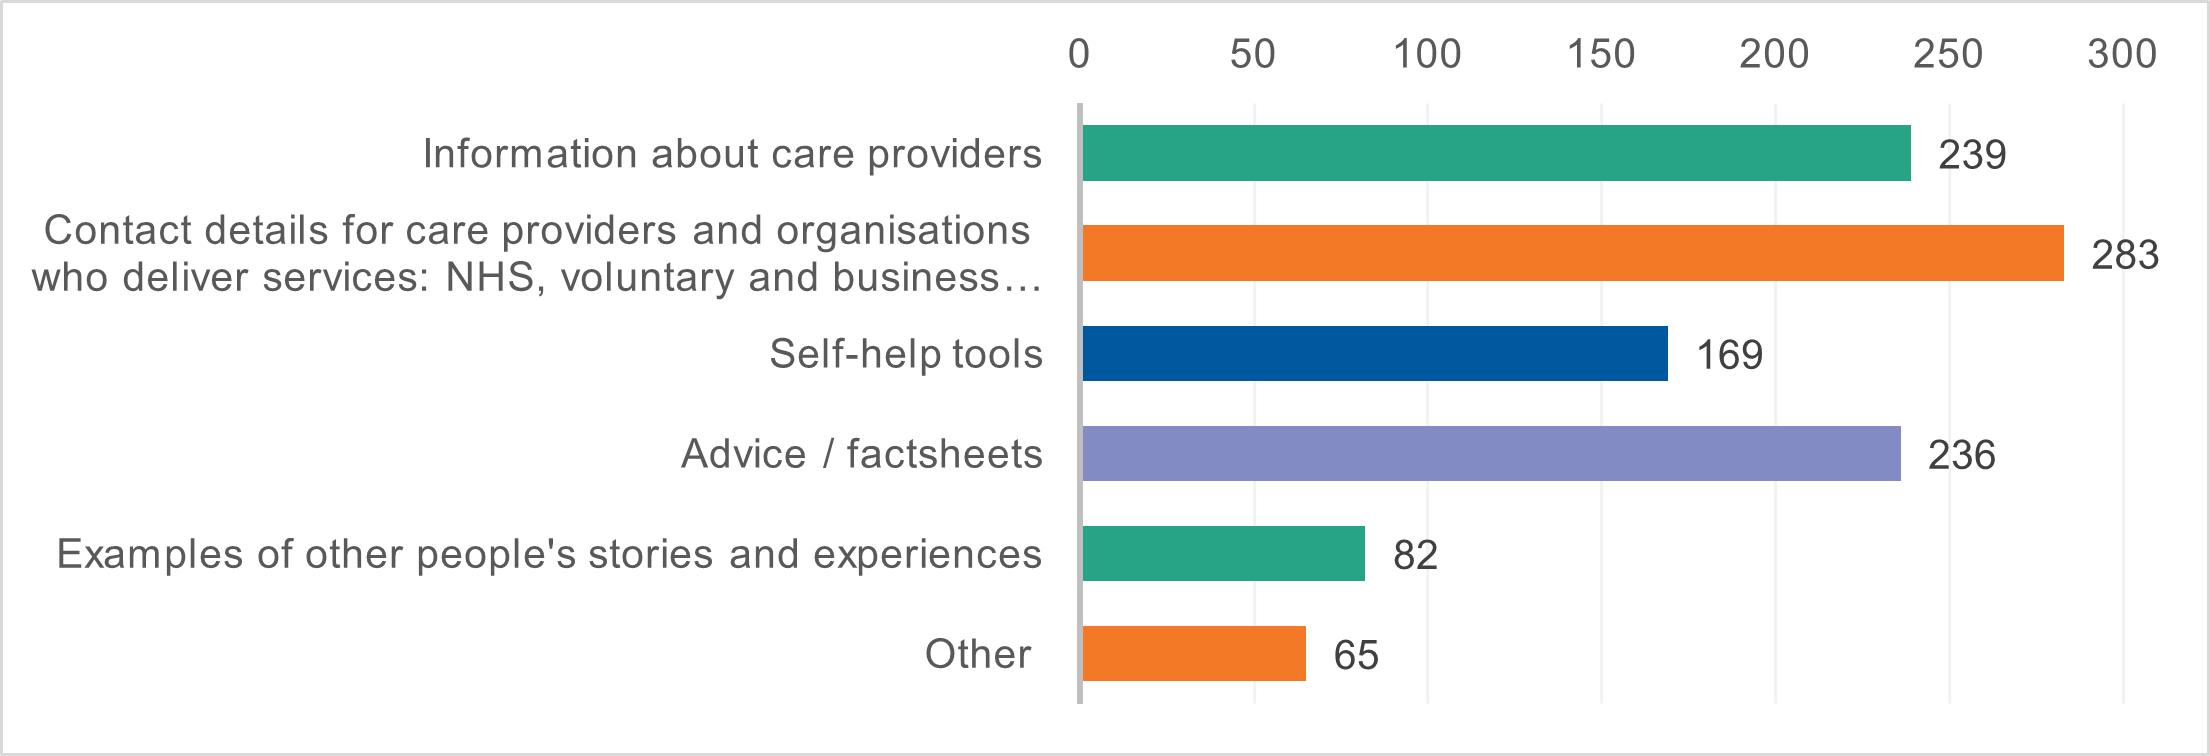
The top three answers about information on the county council website to help individuals to remain safe, well, and independent were:
- contact details for care providers and organisations who deliver services, for example NHS (National Health Service), voluntary sector organisations and local businesses (283 responses)
- information about care providers (239 responses)
- advice or factsheets (236 responses)
There were 65 responses within the ‘other, please specify’ suggestions including:
- 21 respondents said they don't have digital access. Eight others raised concerns about those without digital access and that information should be available in other formats
- 7 respondents suggested a contact person to speak to
- 6 respondents said to include telephone numbers
Age
There was no difference when comparing responses by age among registered respondents.
District
There were slight result differences from registered respondents when comparing by district.
Registered respondents form Boston Borough selected equally self-help tools and advice factsheets as their first choice, followed by information about care providers.
Registered respondents from South Kesteven selected advice and factsheets as their second choice followed by information about care providers.
Disability
The results from registered respondents with a disability showed no difference in views or opinions to those without a disability.
Question eight - We understand that it can be difficult to find the right support for care needs and accessing the right information at the right time is important. Please tell us how you think information should best be made available for people when it is needed.
There were 275 responses to the open text question. The top three suggestions about how information should best be made available for people when they need it were:
- websites (82 responses)
- telephone - either a contact number to a person to speak to or a helpline (59 responses)
- advertising (57 responses)
Registered respondents
There were slight differences in responses from registered respondents. Registered respondents suggested the following as the most important:
- websites
- advertising
- GP surgeries or hospitals (including both printed publicity as well as professional advice during appointments) and telephone or helpline equally
Age
Telephone or helpline was the first choice for those aged 44 and under.
Disability
There was no difference among registered respondents when comparing by disability.
District
Telephone or helpline was the first choice in South Holland. It was second choice equally with advertising in West Lindsey and City of Lincoln.
Who took part (registered respondents)
Breakdown by age
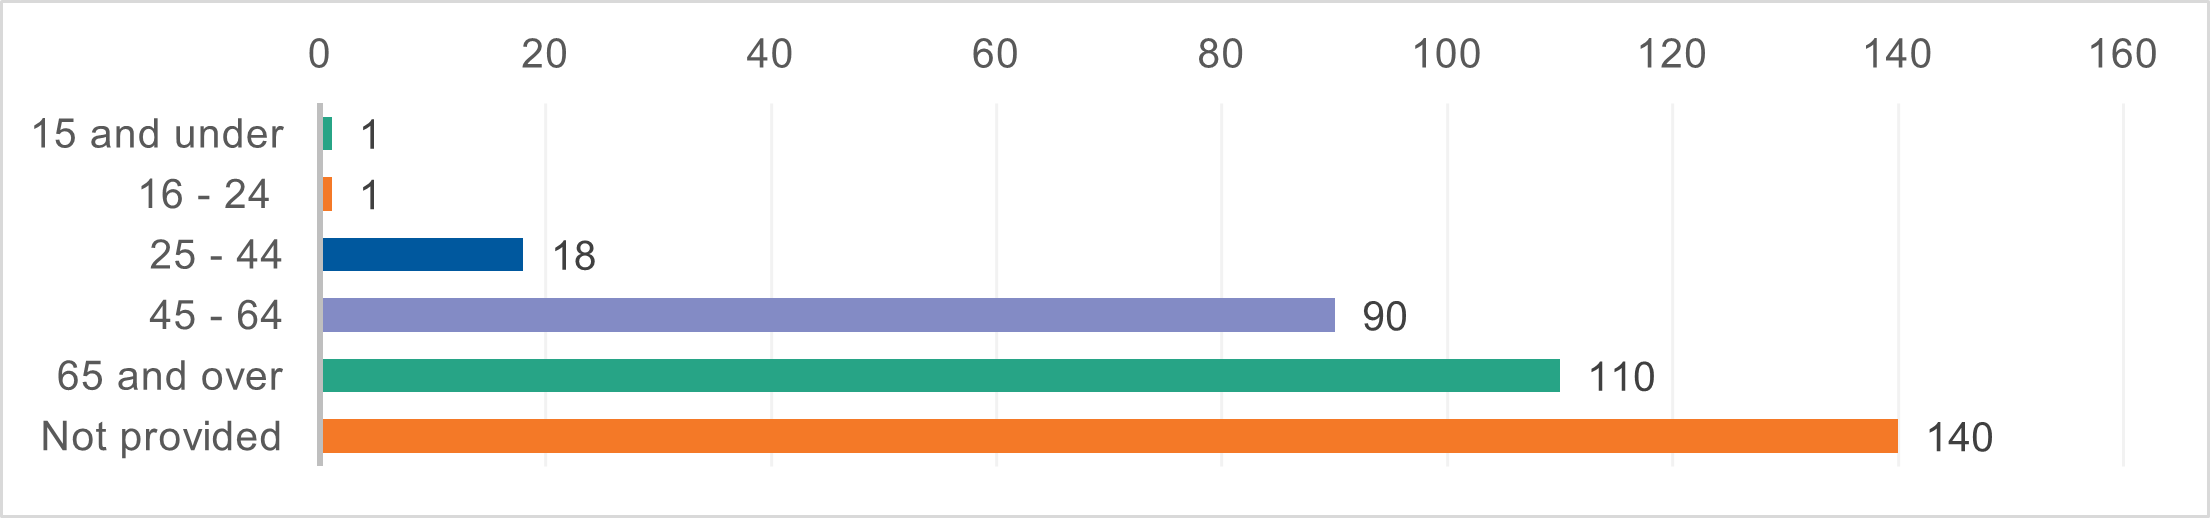
Most respondents were 65 or over (110 respondents) followed by 90 respondents aged 45 to 64. There were 18 respondents aged 25 to 44, one aged 16 – 24 and one was 15 or under.
Breakdown by local council area
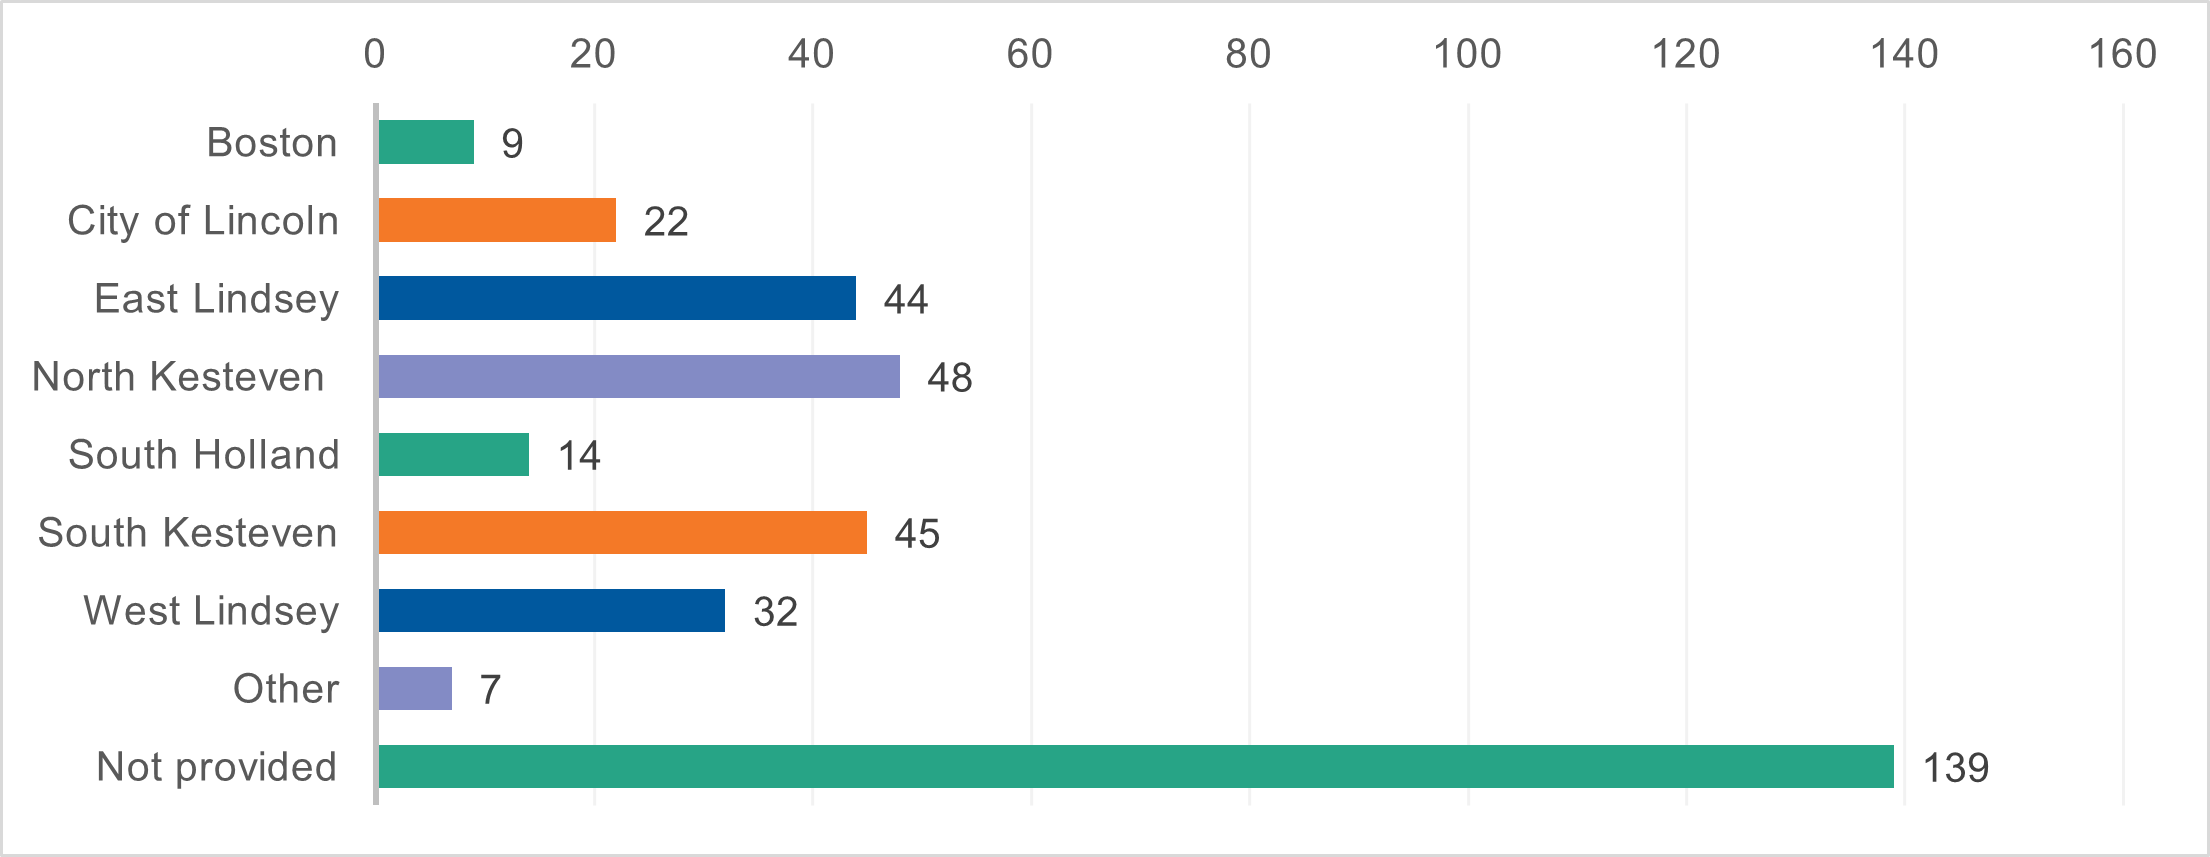
- Boston - 9 respondents
- City of Lincoln - 22 respondents
- East Lindsey - 44 respondents
- North Kesteven - 48 respondents
- South Holland - 14 respondents
- South Kesteven - 45 respondents
- West Lindsey - 32 respondents
- Other – 7 respondents
- Not provided - 139 respondents
The highest number of responses came from North and South Kesteven followed by East Lindsey. The fewest came from Boston Borough and South Holland, which reflects the usual trend.
Disability
51 people said they have a disability, which is broadly representative of Lincolnshire’s population.
Ethnicity
One person identified as being from a mixed ethnic background.
Next steps
We ask the questions so we can reflect and act on the feedback we receive. We will share the results with the Information and systems, Adult care and community wellbeing team. The results will feed into the information and advice offer review to improve service provision in Lincolnshire.